Line chart needs to sow zero and nothing for weeks in the future

Hi PBI’ers
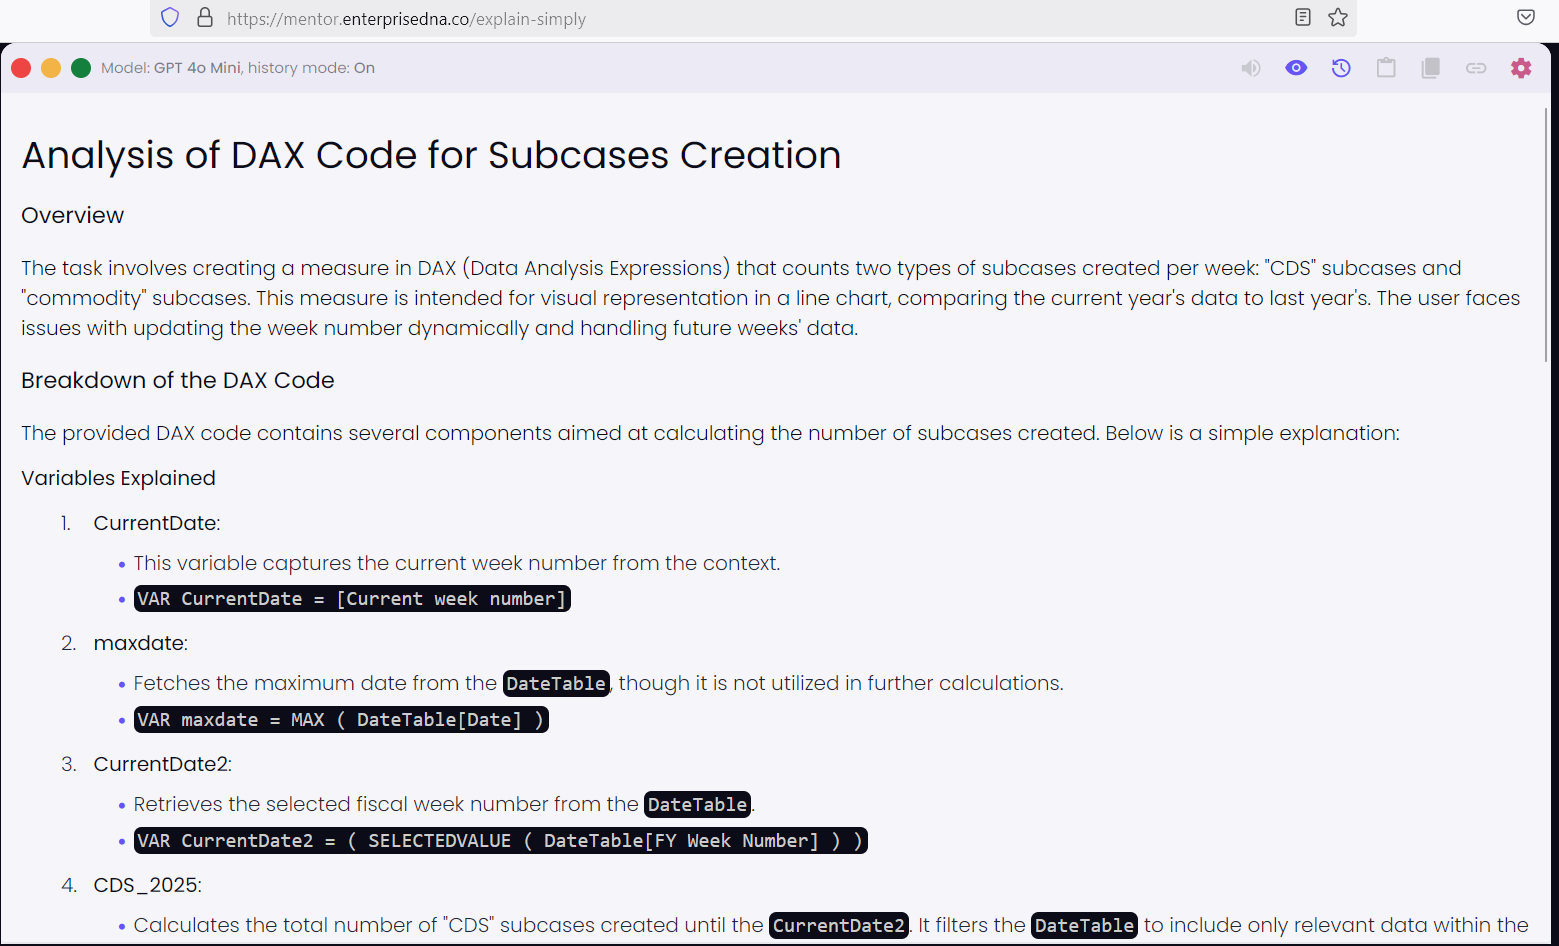
I need to create the number of “subcases created” per week. There are two types of subcases: ones that contain “CDS” in the string, known as CDS subcases, and ones that don’t contain CDS in the string known as “commodity” subcases.

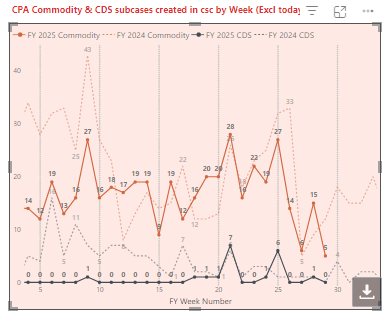
This is plotted on a line chart of current year vs last year. In some weeks there are 0 subcases created and I need the plot to show 0. I also need it to show nothing for the weeks that haven’t happened yet.
image

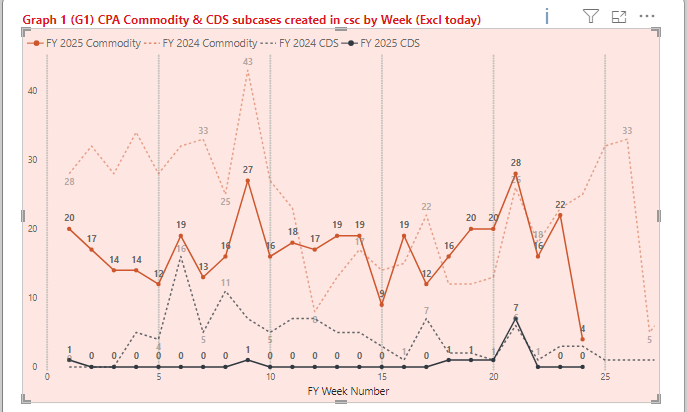
I’ve managed to get it to show zero, but for some reason I can’t use the variable in place of the week number in the below code, I have to update it manually each week. Or I can get it to work but the CDS 2025 line will show ‘0’ for all the weeks in the future as well.

Have stripped out all the confidential stuff, so if look at the file the subcase names are gibberish except for if it contains “CDS” in the string, I’m only counting the rows so it doesn’t matter what they say, apart from if it does or doesn’t contain “CDS”.

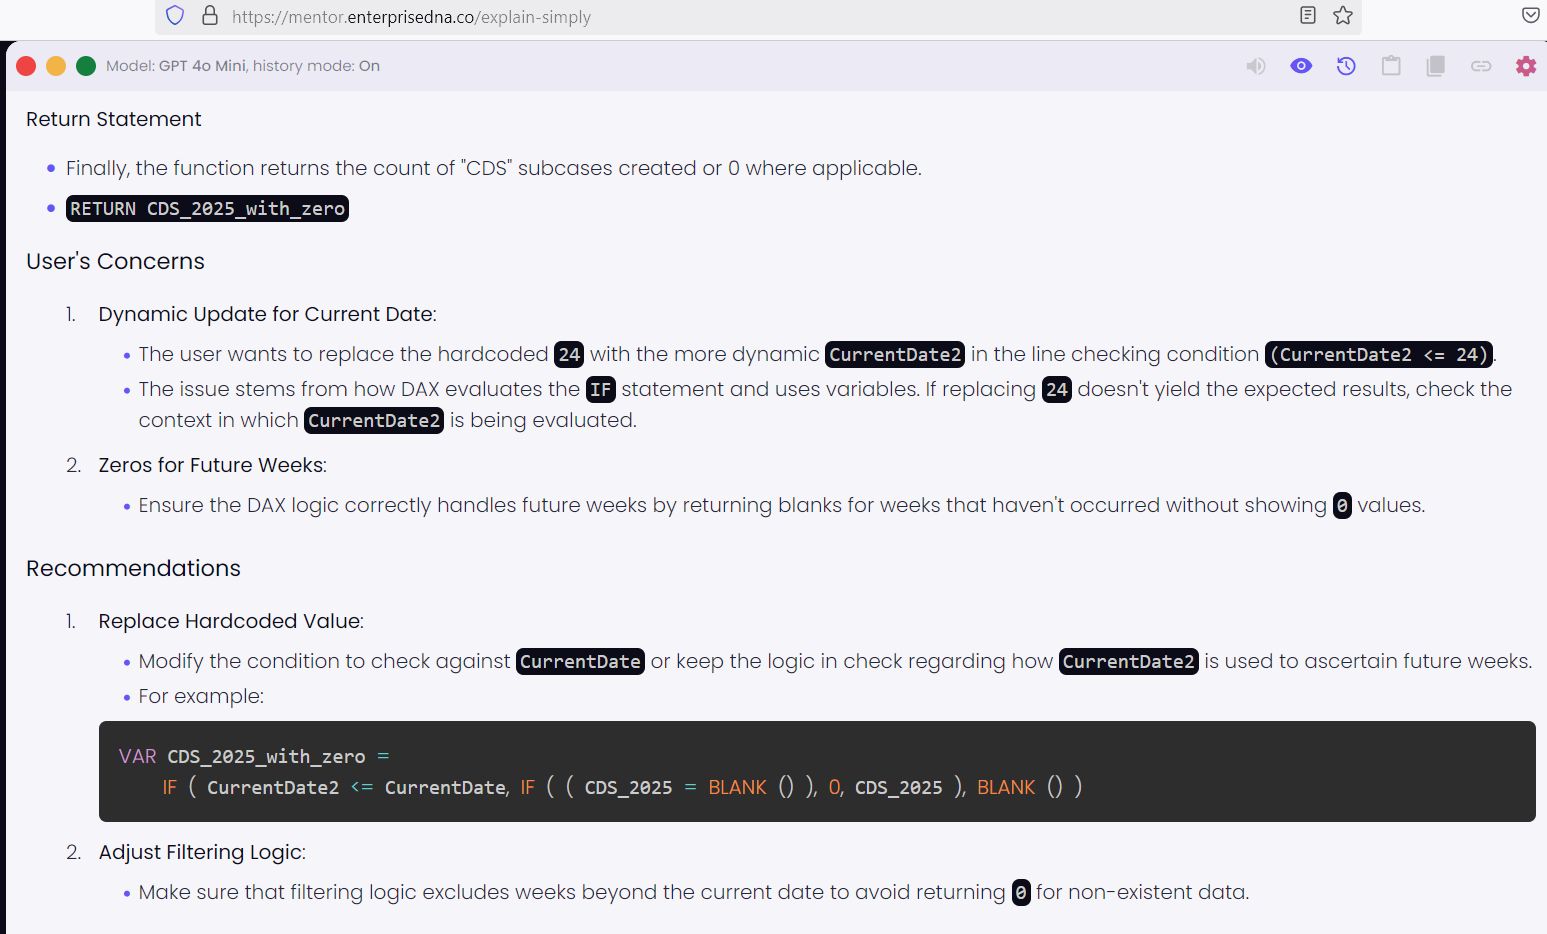
At the bottom of the dax below where it says “IF ( CurrentDate2 <= 24” I should be able to replace the 24 with the VAR CurrentDate2, but it doesn’t work. (for Fin Year week 24)

Any assistance much appreciated !

G1 CPA (CDS) "Created". Excl TODAY FY2025 NEW - needs weekly update =
VAR CurrentDate = [Current week number]
VAR maxdate =
    MAX ( DateTable[Date] )
VAR CurrentDate2 =
    ( SELECTEDVALUE ( DateTable[FY Week Number] ) )
VAR CDS_2025 =
    CALCULATE (
        [G1 CPA (CDS) "Created". Excl TODAY (SRM)],
        FILTER (
            DateTable,
            ( DateTable[Current or Last FY] = "CurrentFY"
                && DateTable[FY Week Number] <= CurrentDate2 )
        )
    )
VAR CDS_2025_with_zero =
    IF ( CurrentDate2 <= 24, IF ( ( CDS_2025 = BLANK () ), 0, CDS_2025 ), BLANK () )
RETURN
    CDS_2025_with_zero

Hi @Claire ,

Thank you for reaching out to the community.

While we wait for other members to share their insights, we’ve taken the liberty of using “Explain Simply ,” one of the tools available within Data Mentor (you can explore it here: https://mentor.enterprisedna.co/explain-simply . It generated the following results:.

Feel free to checkout more of our Data Mentor features as you work on your report. These tools are designed to help with tasks like the one you’re working on.

Cheers,

Enterprise DNA Support Team

Hi, thanks for that - I managed to solve the problem.

Hi @Claire
We are glad you were able to solver your issues. Can you please post your solution so others in the community can learn as well.

thanks
Keith

Managed to get it to work using this approach (disclaimer: I barely know what I’m doing in PBI, but get away with it as my immediate team know even less, so I don’t know if this is the best solution).

So my date table has custom column for the FY week number and a column that has either “CurrentFY” or “LastFY”.

My data is coming from a sheet called “CPAStatusAllTimeSubcase”, which is an export from salesforce.

It has the Subcase names in it with a column called “Field/Event (SRM)”, which might have the word “Created” in it, meaning that the subcase was created (also lots of other events) and another column called “Edit Date” which has the date the “Created” event happened. Some of the subcase names have the string “CDS” and some don’t.

I just needed to count the CDS ones, the non CDS ones for both FY2024 and FY2025 (separately), make a plot to show 0 when there were no subcases created that week, not show a marker for weeks in the future, and exclude any subcase created TODAY() since the report is delivered in the morning for all the work that happened the day before (confusing but that last bit isn’t too relevant)

In the end it was way simpler than I was making it - had to make two new columns in the sheet CPAStatusAllTimeSubcase, which were lookups to the date table to tell me what FY week and FY Year the Edit date was in. Then did this.

I also have a measure for the current week number.

Current week number =
VAR CurrentDate =
    TODAY ()
RETURN
    CALCULATE (
        MAX ( DateTable[FY Week Number] ),
        FILTER ( DateTable, DateTable[Date] = CurrentDate )
    )

Doing FY 2024 data is no dramas as all the weeks are in the past

G1 CPA (CDS) "Created". Excl TODAY (SRM) FY2024 =
COUNTROWS (
    FILTER (
        'CPAStatusAllTimeSubcase',
        'CPAStatusAllTimeSubcase'[Lookup To FY for Edit Date] = "LastFY"
            && 'CPAStatusAllTimeSubcase'[Field / Event (SRM)] = "Created."
            && CONTAINSSTRING ( 'CPAStatusAllTimeSubcase'[Subject (SRM)], "CDS" )
              )
) + 0

but for the current FY2025 this worked.

G1 CPA (CDS) "Created". Excl TODAY (SRM) FY2025 =
VAR CurrentWeek = [Current week number]
VAR FutureWeeks =
    MAX ( 'CPAStatusAllTimeSubcase'[Lookup To FY Week Num for Edit Date] ) > CurrentWeek
VAR UpToCurrentWeek =
    MAX ( 'CPAStatusAllTimeSubcase'[Lookup To FY Week Num for Edit Date] ) <= CurrentWeek
VAR CountAll =
    COUNTROWS (
        FILTER (
            'CPAStatusAllTimeSubcase',
            'CPAStatusAllTimeSubcase'[Lookup To FY for Edit Date] = "CurrentFY"
                && 'CPAStatusAllTimeSubcase'[Field / Event (SRM)] = "Created."
                && CONTAINSSTRING ( 'CPAStatusAllTimeSubcase'[Subject (SRM)], "CDS" )
                && CPAStatusAllTimeSubcase[Edit Date (SRM)] <> TODAY ()
        )
    )
RETURN
    CALCULATE ( IF ( FutureWeeks, BLANK (), IF ( CountAll > 0, CountAll, 0 ) ) )

Then plotted the measures against the LOOKUP to FY week number column in CPAStatusAllTimeSubcase on the x axis. Previously I was using the FY Week number from the date table on the x axis, so that definitely wasn’t helping. Final result below and its working for week 29 (current week as of today). Have to wait until next week to see if I get a data point for week 30, but I’m optimistic its working :slight_smile:
image