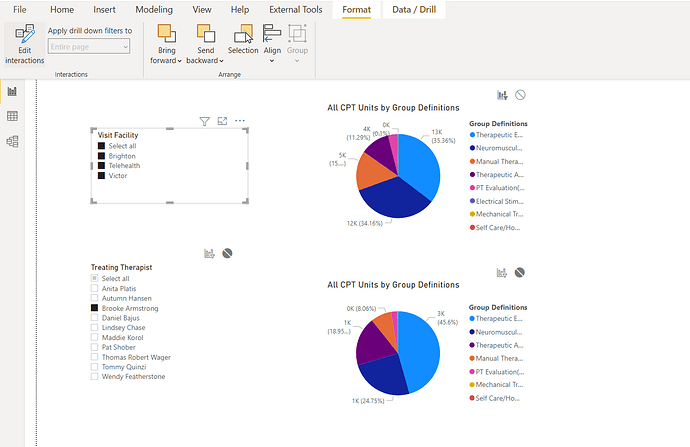
I’m trying to include two pie charts of code analysis on the same page but one that always shows clinic or all company and one that is specific to the therapist.
Is there any way to assign a slicer to only 1 visual on a page to get the result that I’ve mocked up in the PDF or am I resigned to having 2 unique pages to show the data by clinic/company and then again by Therapist?
SlicerComparison.pbix (389.6 KB)
SlicerEx.pdf (90.7 KB)
Seems like there should be a way to show to do this but I haven’t found any discussion on how to assign slicers uniquely on the same page which probably means I’m not asking the question correctly.
Thanks in advance
- gina
