While our users and experts do as much as reasonable to help you with your inquiries, not all concerns can be attended to especially if there are some learnings to be done. Thank you!
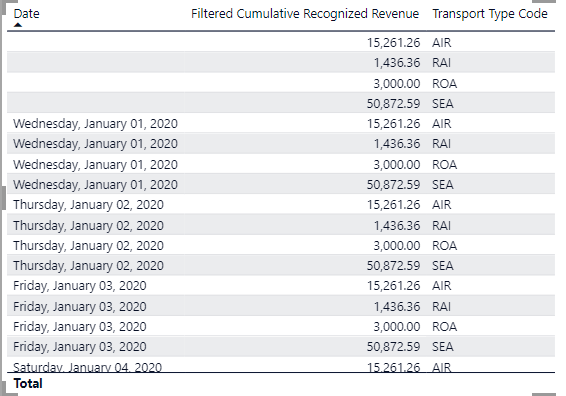
I first changed the chart type to a table as below:
You can see that for each day, the numbers repeat. Therefore, the chart is a flat line. But why? I see a problem in the data model. There is no relationship between the Dates table and the amounts in the Financial Metrics table. I am used to seeing revenue and other metrics like these in the fact table. Financial Metrics is currently a dimension table with a 1-to-1 relationship to the Shipment fact table.
I would go into Power Query and merge these two tables into a single fact table. You might want to eliminate any columns that you don’t plan to use to make it manageable. Then you will have a star schema with revenue being filtered by date.
That’s the first step - then it’s on to reviewing the DAX.
Thank you for taking the time to respond to this thread.
Referring to your line of reasoning:
“You can see that for each day, the numbers repeat.” → Isn’t it supposed to be repeating because it is showcasing the 4 types of transports for each day?
“There is no relationship between the Dates table and the amounts in the Financial Metrics table.” → Can’t relationship be formed with virtual table with DAX?
I think the many ways to arrive at a single outcome in Power BI is the biggest crux in my learning curve. I’m back to drawing board this week – scavenging through the many videos and resources again to narrow down that many ways to one way that suits my train of thought.
You have a point in that sometimes there are many ways to accomplish a single outcome in Power BI. Let me see if I can explain why, in this case, the data model is the first thing to work on.
The experts here at Enterprise DNA (and elsewhere) recommend a star schema data model. Your model is actually close. You have what Sam McKay calls a “waterfall” design to the model with your fact table at the bottom and dimension tables at the top. The next question is, what should be in the fact table vs the dimensions? I think that is where the model needs adjustment. Consider the following best practices video from eDNA expert Greg Philps (start at 2:14):
In this video, we see that transaction amounts are found in the fact table in a star schema. I’ve never seen a model with transaction amounts in a dimension table. If you are going to sum up revenue or calculative averages and/or cumulative totals, those amounts reside in the fact table.
In response to your two points above:
“You can see that for each day, the numbers repeat.” → Isn’t it supposed to be repeating because it is showcasing the 4 types of transports for each day? --Yes the four transport categories repeat each day. But no, the amounts shouldn’t be the same. The amounts differ by day and the cumulative total measure should increase daily as long as there is activity for that day. Because the value are exactly the same for each day in the table, we can see that we are not calculating what we would like.
“There is no relationship between the Dates table and the amounts in the Financial Metrics table.” → Can’t relationship be formed with virtual table with DAX? – In theory I think yes you could. But, the DAX is simpler with a star schema. And, if you are using sample DAX based on a star schema (like Sam’s cumulative pattern), it won’t work unless your model can filter the amounts by day.

 ?
?