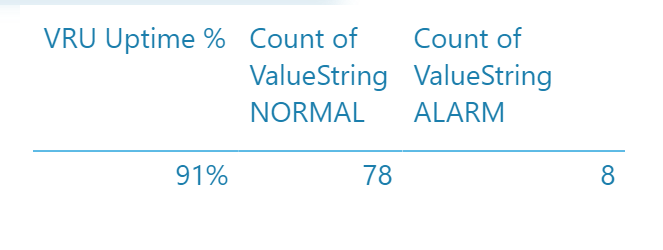
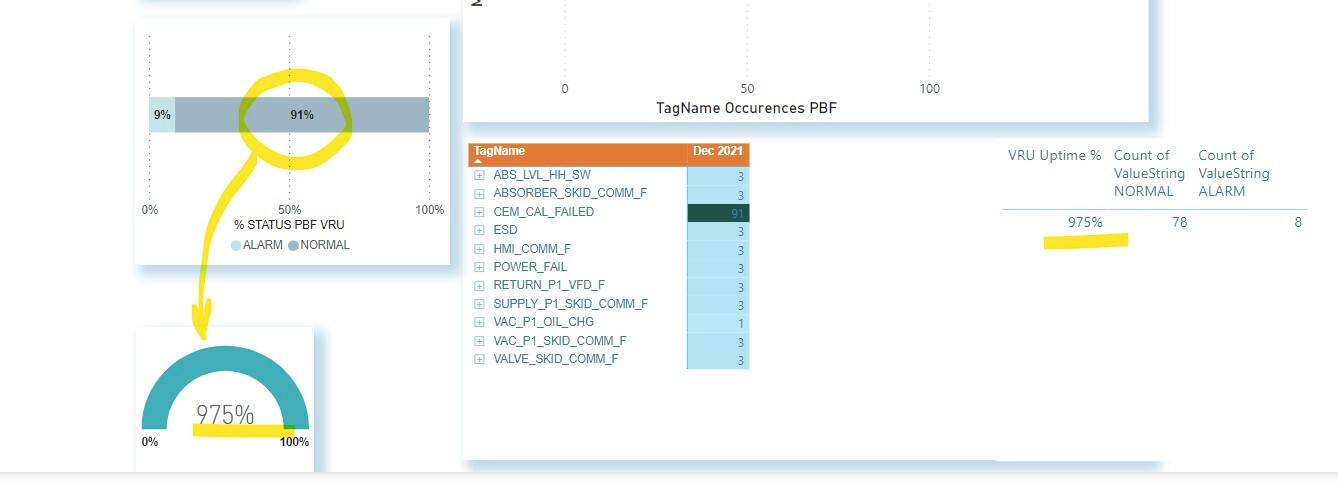
Hello. I know this is a simple solution but I’m stuck. But I want to show in the attached pbix file the percentage of VRU uptime (VRU = Vapor Recovery Unit). The VRU runs in Normal operation and then has alarms. I have % of grand total for the the VRU performance. I want to show as a KPI with a target value of 100% the Normal runtime amount. In the bar chart you can see it’s 91%. I want that in a KPI visual ike a dial gauge. I’ve done a COUNTROWS measure for the valuestring column which contains Normal and alarm in that column.
The measure I have is VRU % Uptime and the percentage show 975% which is wrong.
Measures:
Count of ValueString NORMAL =
CALCULATE(
COUNTROWS(‘PBFAlarmDetail’), ‘PBFAlarmDetail’[ValueString] = “NORMAL” , ALL( ‘PBFAlarmDetail’[ValueString]) )
Count of ValueString ALARM =
CALCULATE(
COUNTROWS(‘PBFAlarmDetail’), ‘PBFAlarmDetail’[ValueString] = “ALARM” , ALL( ‘PBFAlarmDetail’[ValueString]) )
VRU Uptime % =
DIVIDE( [Count of ValueString NORMAL], [Count of ValueString ALARM], 0)+0
Let me know if you have any questions. Thanks
VRU UPTIME DASHBOARD.pbix (2.9 MB)