Hi @Wlknsn.
(I ended-up diving into this anyway before I saw your follow-up post, and have a generic example that might help.) I created a disconnected table to use as the basis for a table visual (which gives you more options, I find)
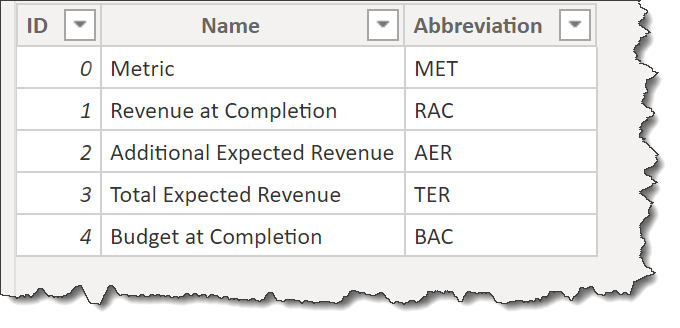
Then, [2LM] and [LM] measures can be used to set the values that will be shown, something like:
2LM =
VAR _SelectedMetricID = MAX( Metrics[ID] )
VAR _RevenueAtCompletion = [Total Sales]
VAR _AdditionalExpectedRevenue = [Total Sales] * 0.25
VAR _TotalExpectedRevenue = _RevenueAtCompletion + _AdditionalExpectedRevenue
VAR _BudgetAtCompletion = _RevenueAtCompletion * 1.1
RETURN

SWITCH( TRUE(),
    _SelectedMetricID = 0, 0,
    _SelectedMetricID = 1, _RevenueAtCompletion,
    _SelectedMetricID = 2, _AdditionalExpectedRevenue,
    _SelectedMetricID = 3, _TotalExpectedRevenue,
    _SelectedMetricID = 4, _BudgetAtCompletion,
    BLANK()
)
and as well you can use conditional formatting to choose icons, which perhaps can be used in lieu of the “Trend” column. Another option to allow the setting of (fake) column headers is to add your header of choice into row 0 and use conditional formatting to set the background and font colour. You can then add “text” versions of your measures to get the column headers you want.

Hope this helps.
(I’ll now start processing your posted sample to see if I can apply these techniques to you specific situation, and I’ll post again once ready.)
Greg
eDNA Forum - KPI Matrix.pbix (374.6 KB)