I’m sure this is very easy to do – however, I can’t figure it out.
I have the following tables:
GF Balance [balance], [date]
GF Expenses [budgeted expenses], [date]
We have an internal requirement to keep General Fund Balance above 3-months of budgeted expenses.
I created the following measures:
1. Total Expense Budget = sum( GF Expense[budgeted expenses])
2.  Avg Monthly Expenses = divide( [total expense budget], 12)
3.  Reserves = calculate( [avg monthly expenses] * 3)
If I slice for the year (2018) and put in a table the result is as expected
Total Expense Budget | Avg Monthly Expenses | Reserves
236,444 19,703.67 59,111
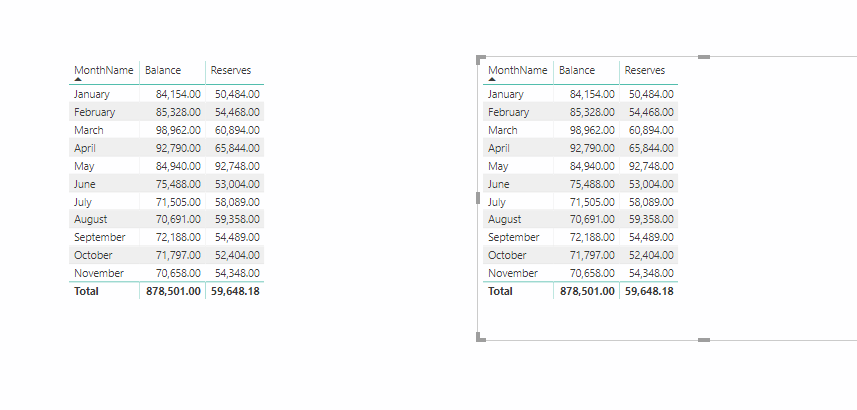
When I put in a table with Month, Balance, Reserves
the result:
January 88,892.43 4,207.00 and so on.
In a graph, the monthly balance shows as expected. But I need the 3-month reserves (59,111) to show across the year.
Thanks for your help!
John
Read through this one a few times.
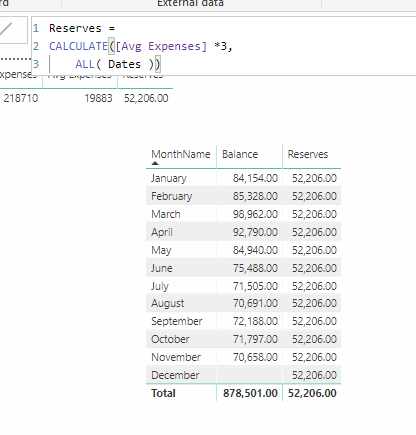
My conclusion is that you likely need to utilise an ALL statement here is you want to show this amount across an entire year and not have it filtered.
Something like the below.
CALCULATE( Reserves, ALL( Dates[Year] ) )
Check out the below for more information on the ALL function (and it’s derivatives)
http://portal.enterprisedna.co/courses/mastering-dax-calculations/lectures/2000639
Thanks Sam!
I appreciate the quick response. I watched the video – and will re-watch it tomorrow as my brain is tired from two straight days of PowerBi and EnterpriseDNA. I will get back to you on how it comes out.
John
Greetings everyone,
I’m throwing in the white towel. I have spent hours trying to figure out the most basic of functions. I lay in bed at night, tossing and turning trying to wrap my head around this seemingly, simple problem. Please lend a hand before my wife whacks me with a Powerbi manual.
Here is the scenario:
We are a nonprofit organization. We need to make sure our monthly balance does not dip below a three-month average of budgeted expenses. For example if Novembers balance is $75,000, and our expenses average 60,000 for a three-month period - we are okay.
I have created a sample .pbix and will upload it. It is very simple with the following tables:
Dates (created with your code - thanks)
Expenses (monthly budgeted expenses)
Balance (monthly fund balance).
I tried multiple variations of the “All” statement but to no avail.
I am able to get it ‘almost’ right - but I need to build a chart where the ‘reserves’ stay constant across the months (ie, 65,000 in January, February, etc.) and plot the balance against it.
I appreciate anything you can help with.
Thanks,
JohnReservesLineSample.pbix (146.5 KB)
Ok let’s work through this.
First recommendation when looking to work out formulas is to look at the numbers in a table. It’s helps a lot to understand how things adjust with any change in the measure.
To work out a moving average you want to be using the technique below
Is this what you need though? I’m not so sure.
I’m a bit confused around the 65K you mentioned. I’m not too sure where that gets calculated from. What about the below?
Also here’s another idea to look at… this sums up the current month and prior 2 months expenses.
Prior 3 Month Total Exp. =
SUMX(
    DATESINPERIOD( Dates[Date],
        MAX( Dates[Date] ), -3, MONTH ),
            [Avg Expenses] )
Somewhere among these examples is the answer you’ll need.
See how you go.
Sam,
Once again, you amaze me with your grasp and your attention to helping your students. Sorry for the confusion with the example of 65k that was just an example.
Just think, one day you will look back and say, “I remember when this guy couldn’t even do a simple MA, now he is a BI consultant.”
I will get there! I won’t give up.
Thanks again for all your help!
John