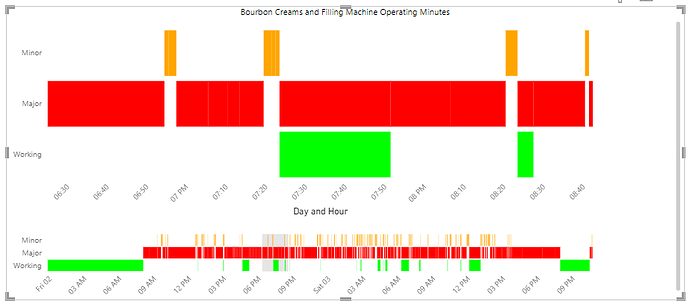
As a part of the Challenge 18 OEE Reporting I have been working on a linked visual that is similar to a chart recorder. Built this up from an EMPTY template with snippets from the GANTT and Overview and Detail examples from the Vega-Lite Gallery. Also, carefully followed Greg’s worked example (youtube video) for Challenge 17. The template has JSON errors “should NOT have additional property: vconcat” and “should not have additional property: mark & width” and finally a “should match some schema in anyOf” - multiple entries of these errors. What I KNOW is that:
- the mark, width and anyOf entries appeared after changing the x axis to ‘temporal’
- the other errors came with the addition of “x2” for the end of each bar segment.
The exported template using some of the Challenge 18 data is below as well as an example pbix with the working Visual (brush with wheel depress or right mouse to select a region on the lower chart which is expanded on the upper linked chart)
{
  "$schema": "https://vega.github.io/schema/vega-lite/v5.json",
  "usermeta": {
    "deneb": {
      "build": "1.1.0.0",
      "metaVersion": 1,
      "provider": "vegaLite",
      "providerVersion": "5.2.0"
    },
    "interactivity": {
      "tooltip": true,
      "contextMenu": true,
      "selection": true,
      "dataPointLimit": 50
    },
    "information": {
      "name": "Strip Chart v2",
      "description": "linked visual of strip chart.  Select range in lower visual to highlight in upper visual",
      "author": "Tim Boeve",
      "uuid": "80fbd7e7-e095-4113-82e5-c1ad917085af",
      "generated": "2022-02-19T02:01:39.296Z"
    },
    "dataset": [
      {
        "key": "__0__",
        "name": "Product",
        "description": "PBI Slicer field to select one product for analysis",
        "type": "text",
        "kind": "column",
        "namePlaceholder": "Product"
      },
      {
        "key": "__1__",
        "name": "Machine",
        "description": "PBI Slicer field to select one Machine for analysis",
        "type": "text",
        "kind": "column",
        "namePlaceholder": "Machine"
      },
      {
        "key": "__2__",
        "name": "Start",
        "description": "X Axis start of each bar (interval)",
        "type": "dateTime",
        "kind": "column",
        "namePlaceholder": "Start"
      },
      {
        "key": "__3__",
        "name": "End",
        "description": "X Axis (x2) end of each bar (interval)",
        "type": "dateTime",
        "kind": "column",
        "namePlaceholder": "End"
      },
      {
        "key": "__4__",
        "name": "Duration",
        "description": "Tooltip Detail",
        "type": "numeric",
        "kind": "column",
        "namePlaceholder": "Duration"
      },
      {
        "key": "__5__",
        "name": "Severity",
        "description": "Y-axis variable (ordinal, band)",
        "type": "text",
        "kind": "column",
        "namePlaceholder": "Severity"
      },
      {
        "key": "__6__",
        "name": "OEE Category",
        "description": "Tooltip detail",
        "type": "text",
        "kind": "column",
        "namePlaceholder": "OEE Category"
      },
      {
        "key": "__7__",
        "name": "StartDateTime",
        "description": "Tooltip detail (extract hours-minutes)",
        "type": "dateTime",
        "kind": "column",
        "namePlaceholder": "StartDateTime"
      },
      {
        "key": "__8__",
        "name": "newTotalMade",
        "description": "Tooltip detail",
        "type": "numeric",
        "kind": "column",
        "namePlaceholder": "newTotalMade"
      },
      {
        "key": "__9__",
        "name": "newGood",
        "description": "Tooltip detail",
        "type": "numeric",
        "kind": "column",
        "namePlaceholder": "newGood"
      }
    ]
  },
  "config": {
    "autosize": {
      "type": "fit",
      "contains": "padding"
    },
    "view": {"stroke": "transparent"},
    "font": "Segoe UI",
    "arc": {},
    "area": {
      "line": true,
      "opacity": 0.6
    },
    "bar": {},
    "line": {
      "strokeWidth": 3,
      "strokeCap": "round",
      "strokeJoin": "round"
    },
    "path": {},
    "point": {
      "filled": true,
      "size": 75
    },
    "rect": {},
    "shape": {},
    "symbol": {
      "strokeWidth": 1.5,
      "size": 50
    },
    "text": {
      "font": "Segoe UI",
      "fontSize": 12,
      "fill": "#605E5C"
    },
    "axis": {
      "ticks": false,
      "grid": false,
      "domain": false,
      "labelColor": "#605E5C",
      "labelFontSize": 12,
      "titleFont": "wf_standard-font, helvetica, arial, sans-serif",
      "titleColor": "#252423",
      "titleFontSize": 16,
      "titleFontWeight": "normal"
    },
    "axisQuantitative": {
      "tickCount": 3,
      "grid": true,
      "gridColor": "#C8C6C4",
      "gridDash": [1, 5],
      "labelFlush": false
    },
    "axisBand": {"tickExtra": true},
    "axisX": {"labelPadding": 5},
    "axisY": {"labelPadding": 10},
    "header": {
      "titleFont": "wf_standard-font, helvetica, arial, sans-serif",
      "titleFontSize": 16,
      "titleColor": "#252423",
      "labelFont": "Segoe UI",
      "labelFontSize": 13.333333333333332,
      "labelColor": "#605E5C"
    },
    "legend": {
      "titleFont": "Segoe UI",
      "titleFontWeight": "bold",
      "titleColor": "#605E5C",
      "labelFont": "Segoe UI",
      "labelFontSize": 13.333333333333332,
      "labelColor": "#605E5C",
      "symbolType": "circle",
      "symbolSize": 75
    }
  },
  "description": "An attempt at a chart recorder -like output",
  "data": {"name": "dataset"},
  "vconcat": [
    {
      "width": 860,
      "height": 240,
      "mark": {"type": "bar"},
      "encoding": {
        "y": {
          "field": "__5__",
          "type": "ordinal",
          "title": null,
          "sort": [
            "Minor",
            "Major",
            "Working"
          ]
        },
        "x": {
          "field": "__2__",
          "type": "temporal",
          "scale": {
            "domain": {"param": "brush"}
          },
          "title": "Day and Hour",
          "axis": {"labelAngle": -45}
        },
        "x2": {
          "field": "__3__",
          "type": "temporal"
        },
        "color": {
          "field": "__5__",
          "type": "ordinal",
          "scale": {
            "domain": [
              "Working",
              "Major",
              "Minor"
            ],
            "range": [
              "#00FF00",
              "#FF0000",
              "#FFA500"
            ]
          },
          "legend": null
        },
        "opacity": {
          "condition": {
            "test": {
              "field": "__selected__",
              "equal": "off"
            },
            "value": 0.3
          },
          "value": 1
        },
        "tooltip": [
          {
            "field": "__2__",
            "type": "temporal",
            "timeUnit": "hoursminutes"
          },
          {
            "field": "__4__",
            "type": "quantitative"
          },
          {
            "field": "__6__",
            "type": "nominal"
          },
          {
            "field": "__8__",
            "type": "nominal"
          },
          {
            "field": "__9__",
            "type": "nominal"
          }
        ]
      }
    },
    {
      "width": 860,
      "height": 60,
      "mark": {"type": "bar"},
      "params": [
        {
          "name": "brush",
          "select": {
            "type": "interval",
            "encodings": ["x"]
          }
        }
      ],
      "encoding": {
        "y": {
          "field": "__5__",
          "type": "ordinal",
          "title": null,
          "sort": [
            "Minor",
            "Major",
            "Working"
          ]
        },
        "x": {
          "field": "__2__",
          "type": "temporal",
          "title": false,
          "axis": {"labelAngle": -45}
        },
        "x2": {
          "field": "__3__",
          "type": "temporal"
        },
        "color": {
          "field": "__5__",
          "type": "ordinal",
          "scale": {
            "domain": [
              "Working",
              "Major",
              "Minor"
            ],
            "range": [
              "#00FF00",
              "#FF0000",
              "#FFA500"
            ]
          },
          "legend": null
        },
        "opacity": {
          "condition": {
            "test": {
              "field": "__selected__",
              "equal": "off"
            },
            "value": 0.3
          },
          "value": 1
        },
        "tooltip": false
      }
    }
  ]
}
StripChart v2c.pbix (2.1 MB)
Any suggestions on how to correct these template errors would be appreciated.
Tim
