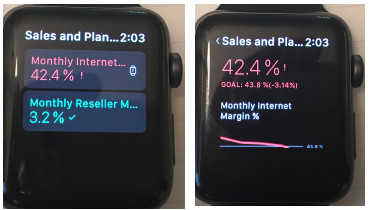
I was able to make a dashboard with only the value cards on iwatch. I wanted to add a kpi visualization to the dashboard so that iwatch would display a line on the timeline. Unfortunately, after adding kpi, iwatch does not display the dashboard. Has anyone managed to do this?
Hi @Harris, we aim to consistently improve the topics being posted on the forum to help you in getting a strong solution faster. While waiting for a response, here are some tips so you can get the most out of the forum and other Enterprise DNA resources.
Use the forum search to discover if your query has been asked before by another member.
When posting a topic with formula make sure that it is correctly formatted to preformatted text </>.
Use the proper category that best describes your topic
Provide as much context to a question as possible.
Include the masked demo pbix file, images of the entire scenario you are dealing with, screenshot of the data model, details of how you want to visualize a result, and any other supporting links and details.
Wait, what?! You’ve successfully synced a live Power BI report to your iWatch?
I’m now imagining doing a Power BI demo, running a dynamic analysis and having the results show up on my watch in real time. I think your post just cost me $400…
Hello @Harris, due to the length by which this post has been active, we are tagging it as Solved. For further questions related to this post, please make a new thread. When starting a new post, I suggest linking this thread, provide as much context to a question as possible and include the masked demo pbix file, images of the entire scenario you are dealing with, screenshot of the data model, details of how you want to visualize a result, and any other supporting links and details. Thanks!