Hi,
I’m encountering issues with my Power BI model, and I’m not sure if it’s a modeling problem or something else. I need to create a stacked bar chart that shows project “Status” (Invoiced - complete, Ordered - booked, and Quoted - expected date) by revenue and Quarter & Year.
The issue seems to stem from the dates not functioning correctly. My initial thought was that this could be due to different status types existing on the same day, so I created separate date columns for each “Status” type. However, it still isn’t working as expected.
In the attached file, the table on the left (which uses the date and status from the fact table) is working correctly. However, the table on the right isn’t functioning as intended—it’s stuck in an “Ordered” selection, even though I didn’t select that filter. This table uses the dates from the date table and the status from the status table.
I hope this explanation makes sense. Ultimately, I need help to get the visual functioning properly. There are filters applied on the dates in both the fact table and the date table, and potentially on the transformation side as well.
Any assistance you can provide would be greatly appreciated.
Thank you for your time!
Project Status.pbix (624.2 KB)
Michael,
Two things. First, you are overthinking how to build your visuals and, second, you have a problem with 'Project Status'[Date].
You don’t need the three measures [Total Sales by Invoiced Date], [Total Sales by Ordered Date], and [Total Sales by Quoted Date]. The single [Total Sales] is all you need.
You don’t need the three calculated columns capturing invoiced date, ordered date, and quoted date. You just need the single Project Status[Date] column that already exists.
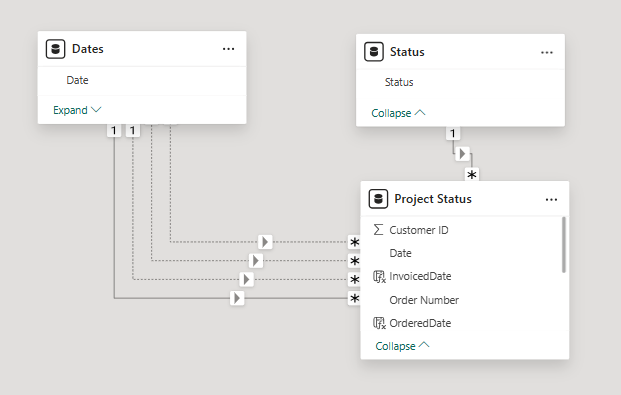
You don’t need the three relationships between 'Dates'[Date] and the three calculated columns capturing invoiced date, ordered date, and quoted date:

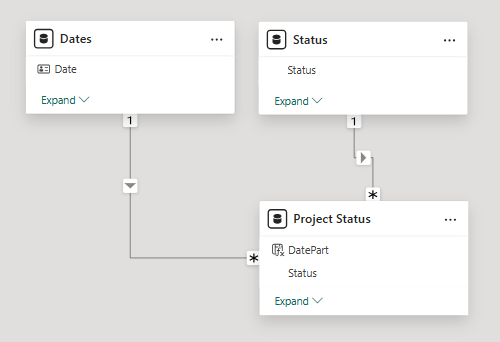
What you need is to ensure 'Dates'[Date] has a relationship with a date column and not a datetime column formatted as a date. If you extract the date part from 'Project Status'[Date], like:
DatePart = FORMAT('Project Status'[Date], "M/D/YYYY")
and then create a relationship between 'Dates'[Date] and 'Project Status'[DatePart], like:

all you need do after that is slice [Total Sales] by ‘Status’[Status].
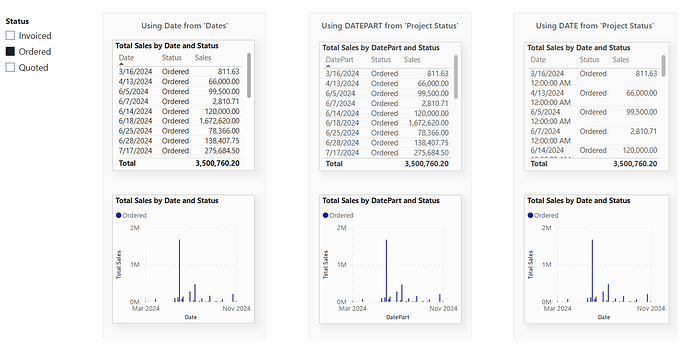
Below is a screenshot of your data with three different versions of two visuals, one tabulating total sales by date and status and the other using the same data as a stacked bar chart. The slicer is like you have it already.
The first set uses 'Dates'[Date] (leveraging the relationship with 'Project Status'[DatePart] created above). The second uses 'Project Status'[DatePart]. The third uses the existing 'Project Status'[Date]:
I hope this helps.
2 Likes
Hi HufferD,
This is definitely a face-palm moment for me! What you suggested makes perfect sense, and it worked perfectly. I can’t believe I overlooked something so simple and was overthinking it.
Thank you so much for your help—I really appreciate it!


