@Irina ,
Okay, I’ve solved your week 53 display problem. I’ve run into this before myself and here’s how I handled it:
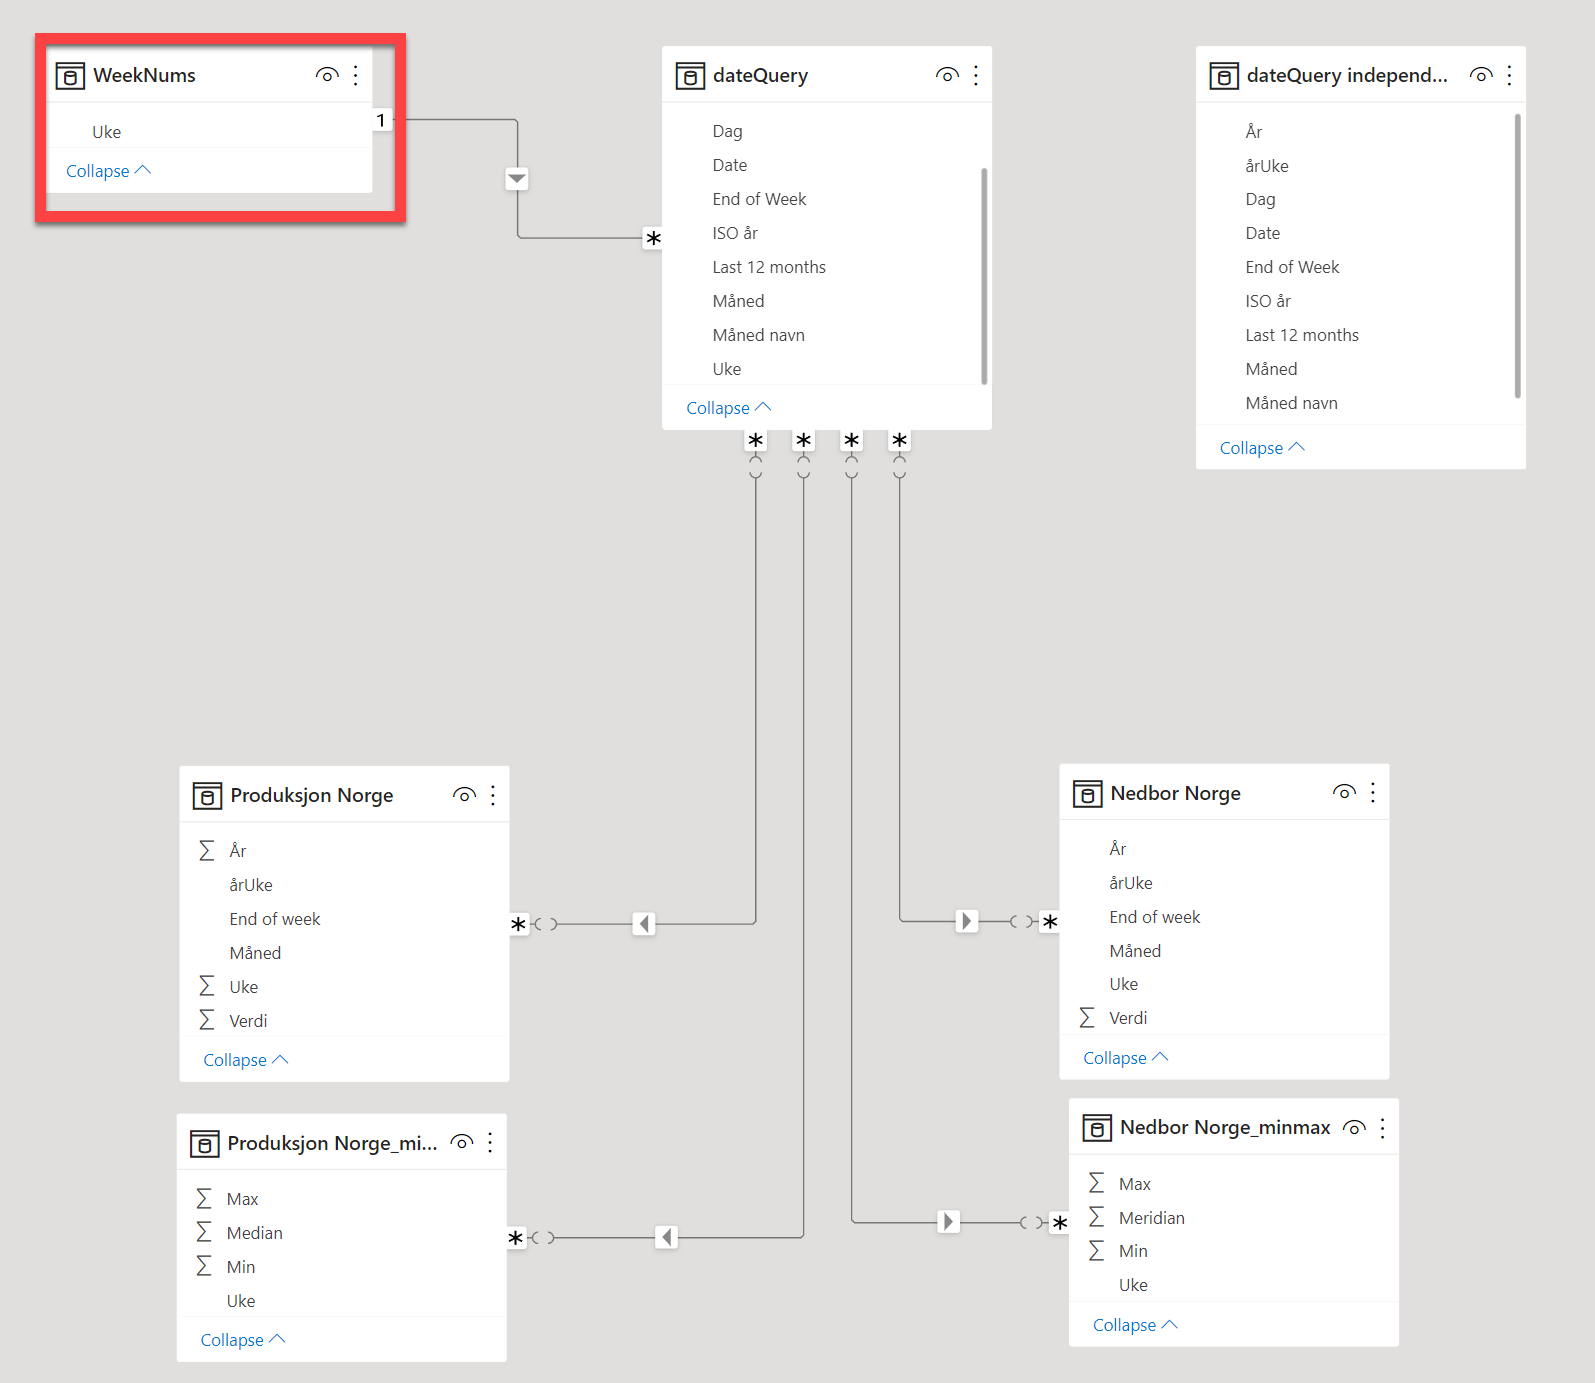
- created a separate week number table from 1 to 53 and snowflaked that off of the primary date table
- replaced the week number field in the table and the visual with the week number from the table created above
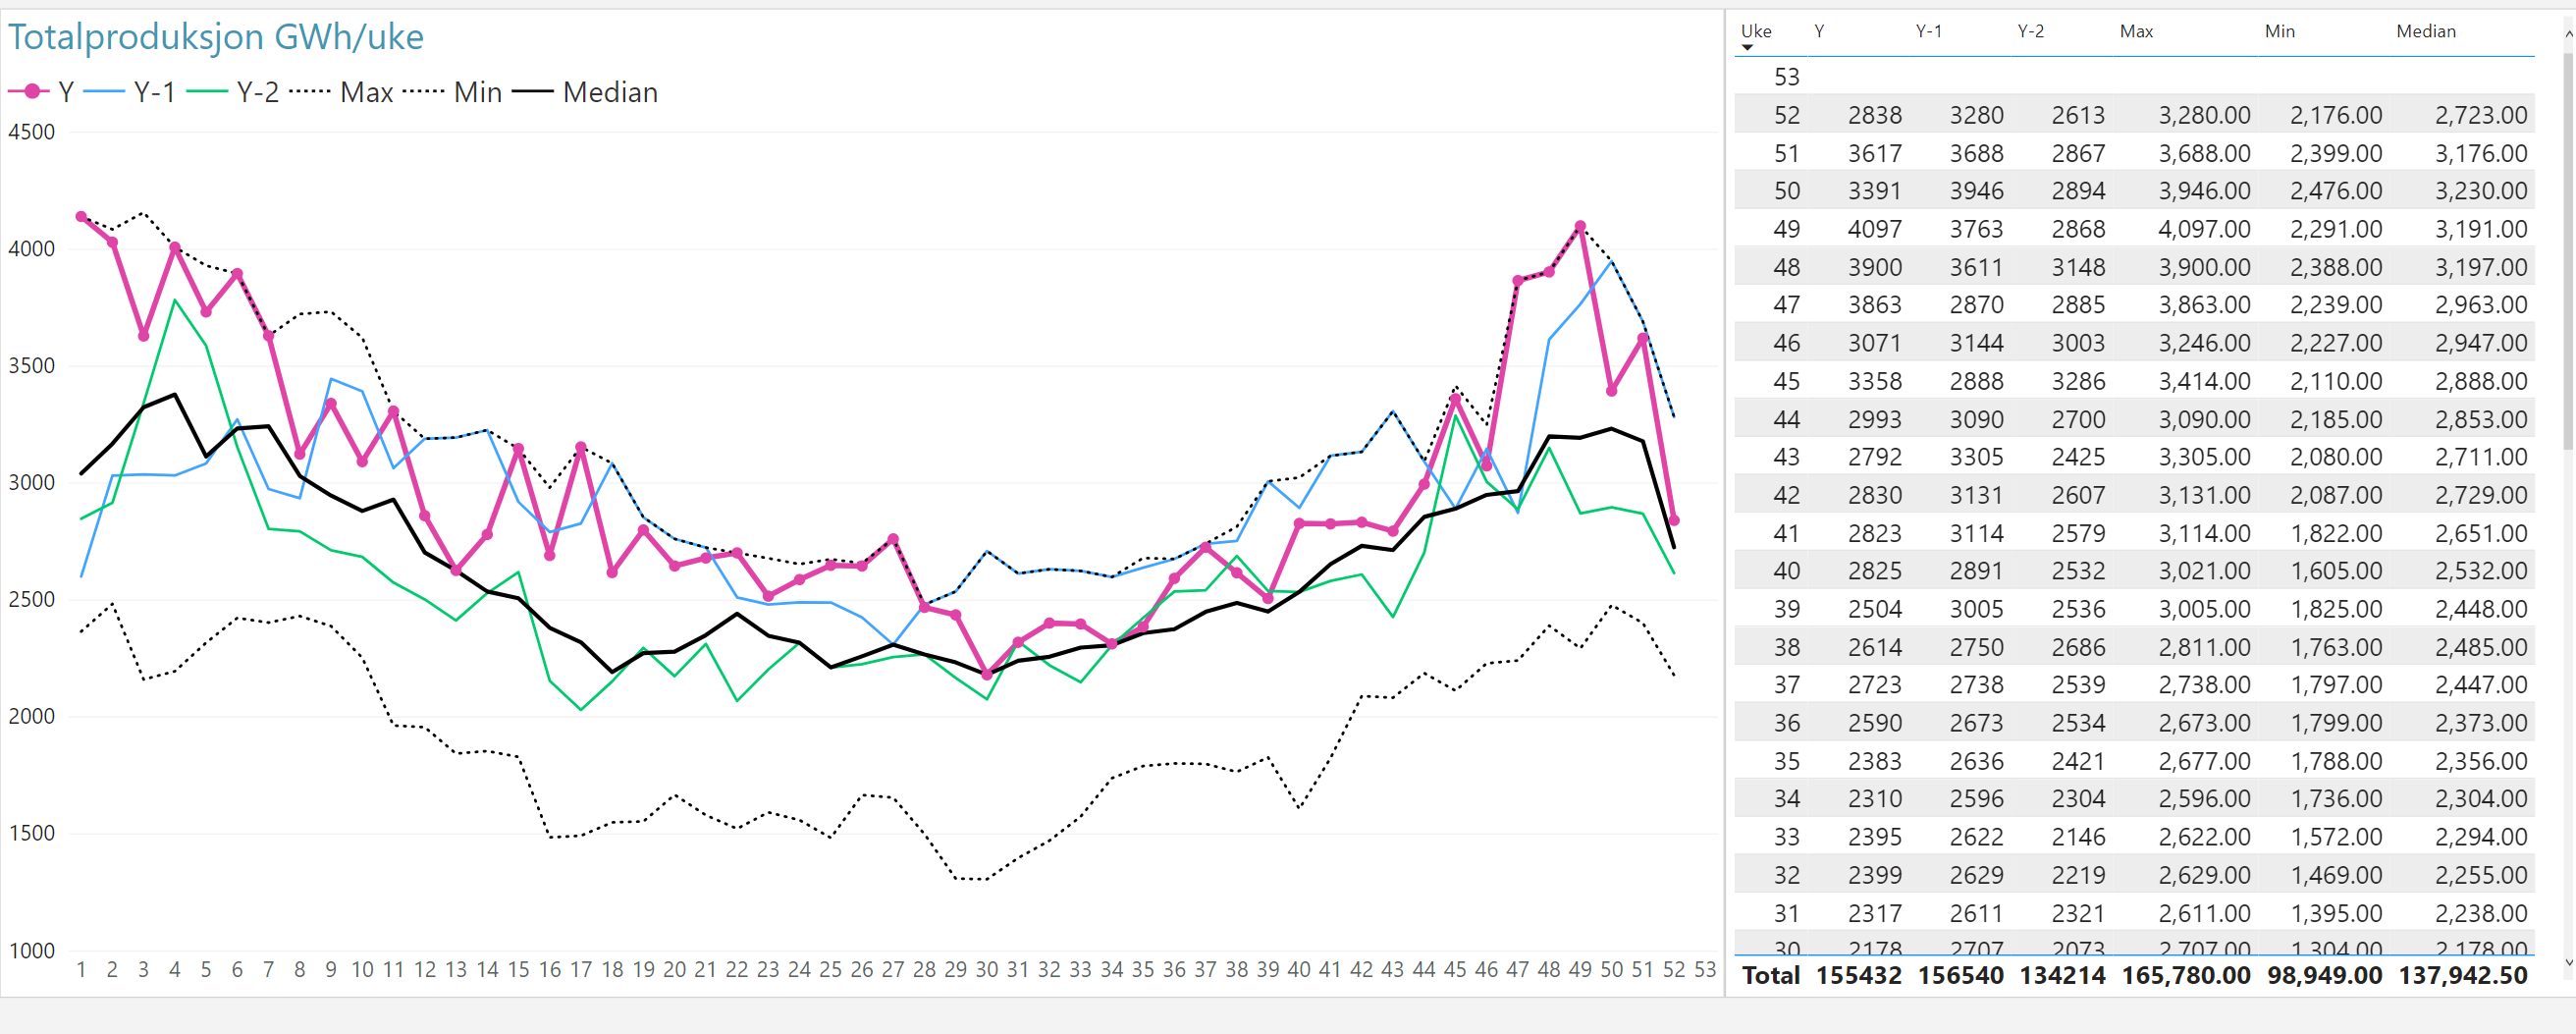
- made sure to turn on the “show items with no data” option. Here’s how the data model and the visual now look:
I do have a question about the week 40 start issue. So, you want the visual to start with week 40 and then loop around to week 39 of the next year? Do you want week 53 to show in all years as well, even in the years that only have 52 weeks?
The way I would handle this is to identify the week offset associated with week 40 of the selected year, and then calculate the offset value 51 or 52 periods from that and then filter your visual by these two values. Once I get your answers to the questions above, I will be glad to provide the specific DAX to do so if you’d like.
I hope this is helpful.
Full solution file provided below for the 53 week question.
– Brian
eDNA Forum - Showing Week 53 solution.pbix (828.2 KB)