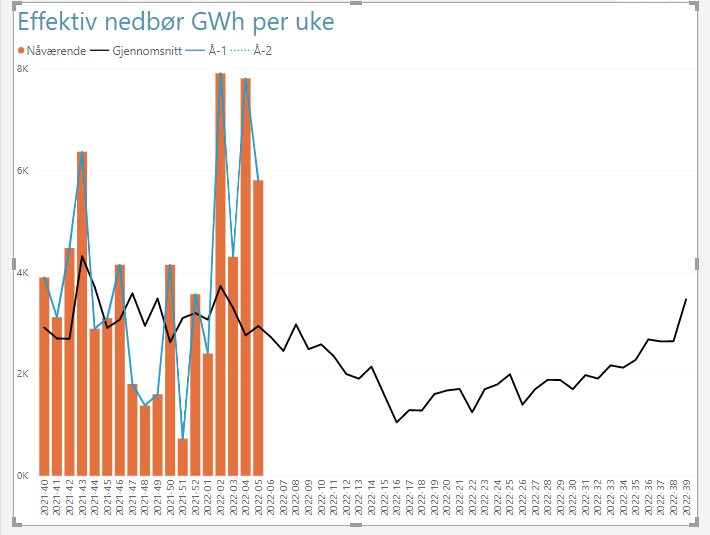
I do have a question about the week 40 start issue. So, you want the visual to start with week 40 and then loop around to week 39 of the next year? Do you want week 53 to show in all years as well, even in the years that only have 52 weeks?
The way I would handle this is to identify the week offset associated with week 40 of the selected year, and then calculate the offset value 51 or 52 periods from that and then filter your visual by these two values. Once I get your answers to the questions above, I will be glad to provide the specific DAX to do so if you’d like.
I hope this is helpful.
Full solution file provided below for the 53 week question.
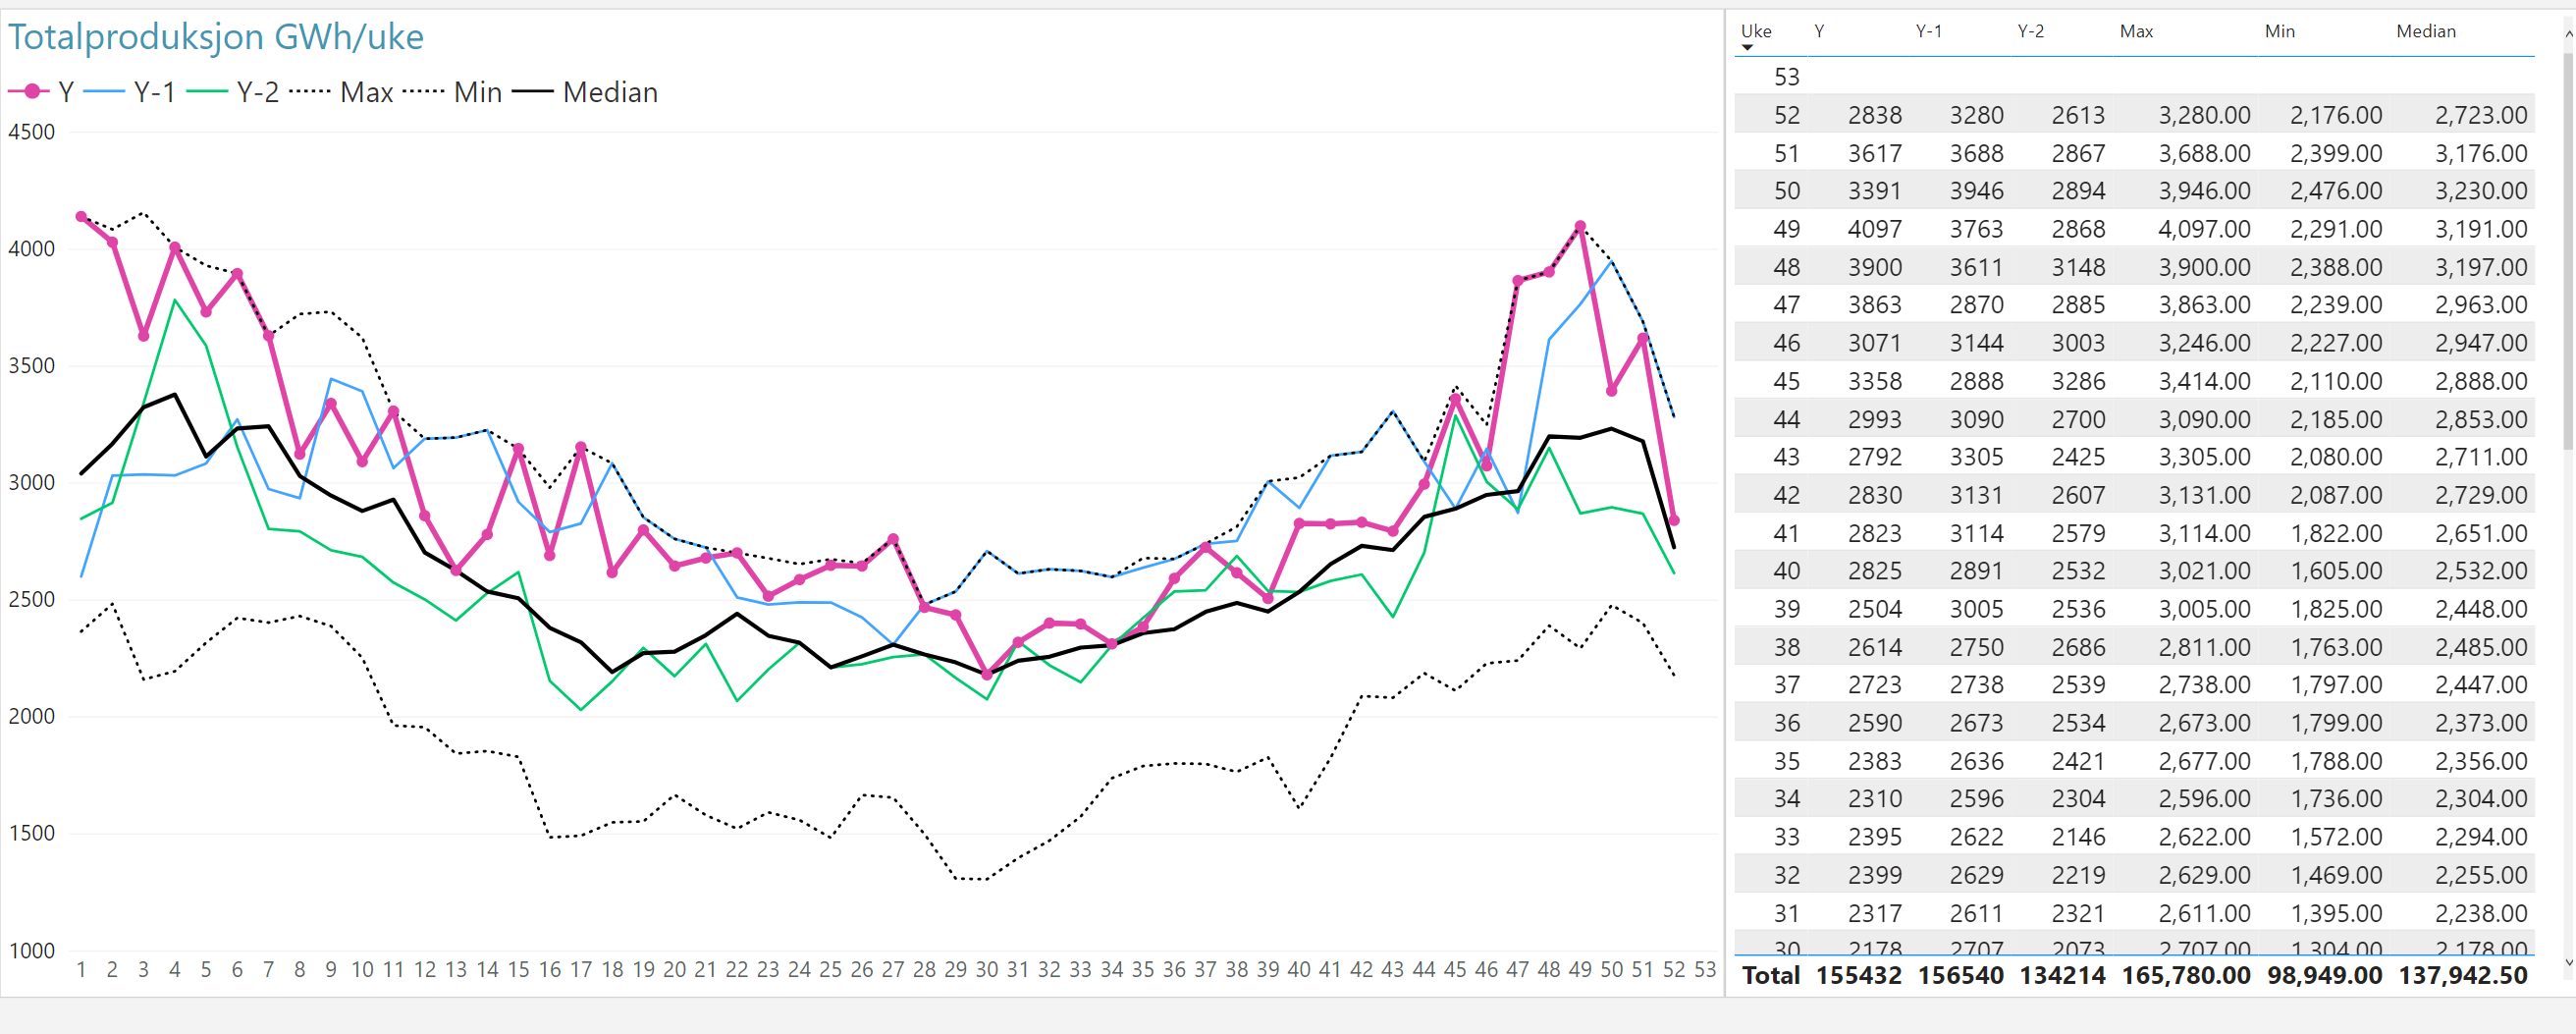
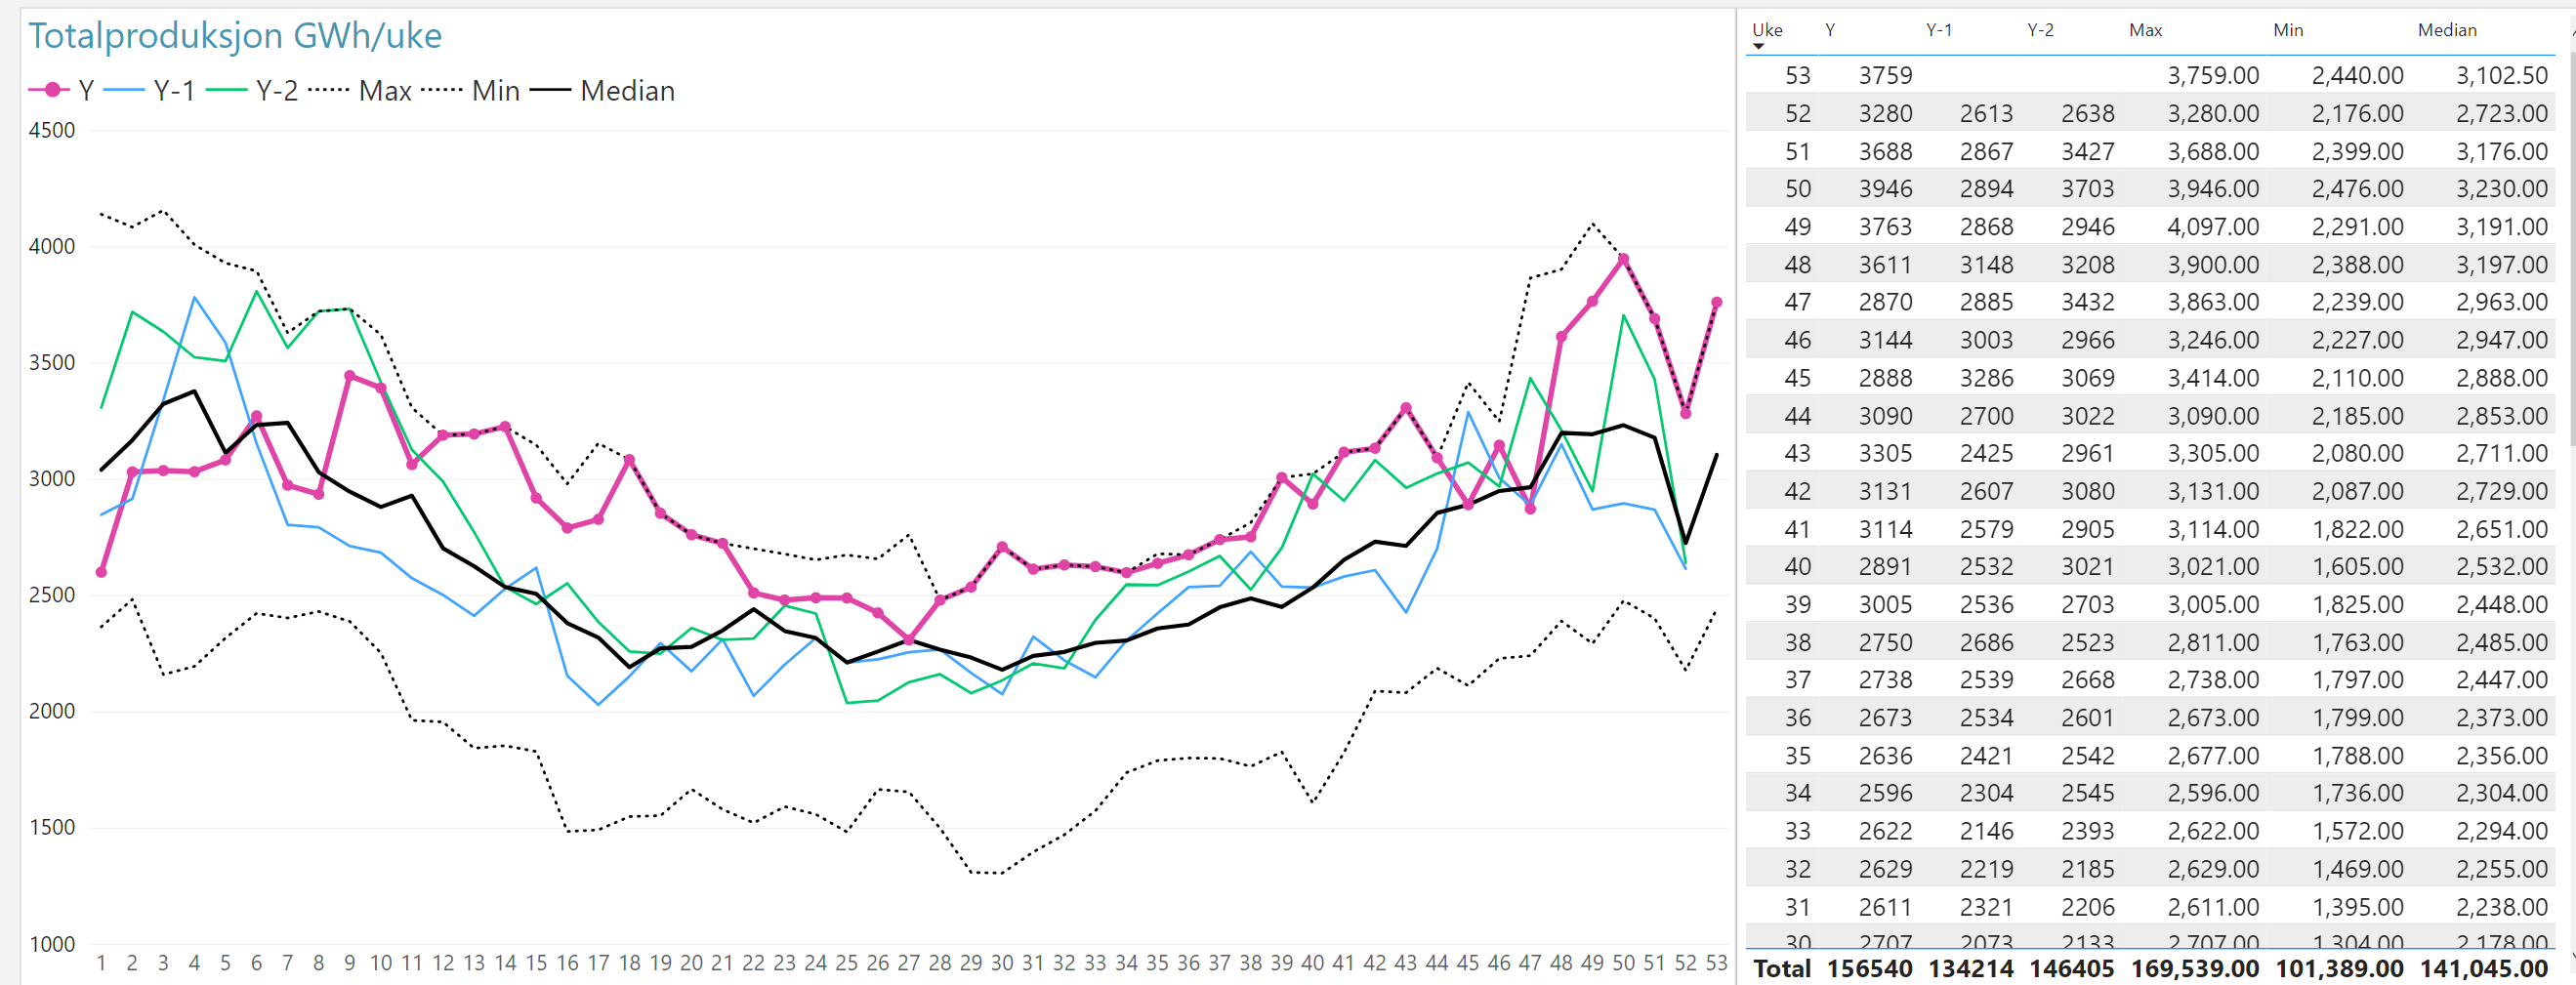
Thank you for quick reply. Appreciate it. #2. I dont think including week 53 gives much value in visuals starting with week 40. For simplicity, lets exclude it. #1. I thought that it will be possible to see week 53 for min, max, median no matter selected year. Or, f.e. if 2022 is selected, week 53 will appear for min, max, median, Y-2(2020). but not for Y-1 (2021), Y(2022), since there is no week 53.
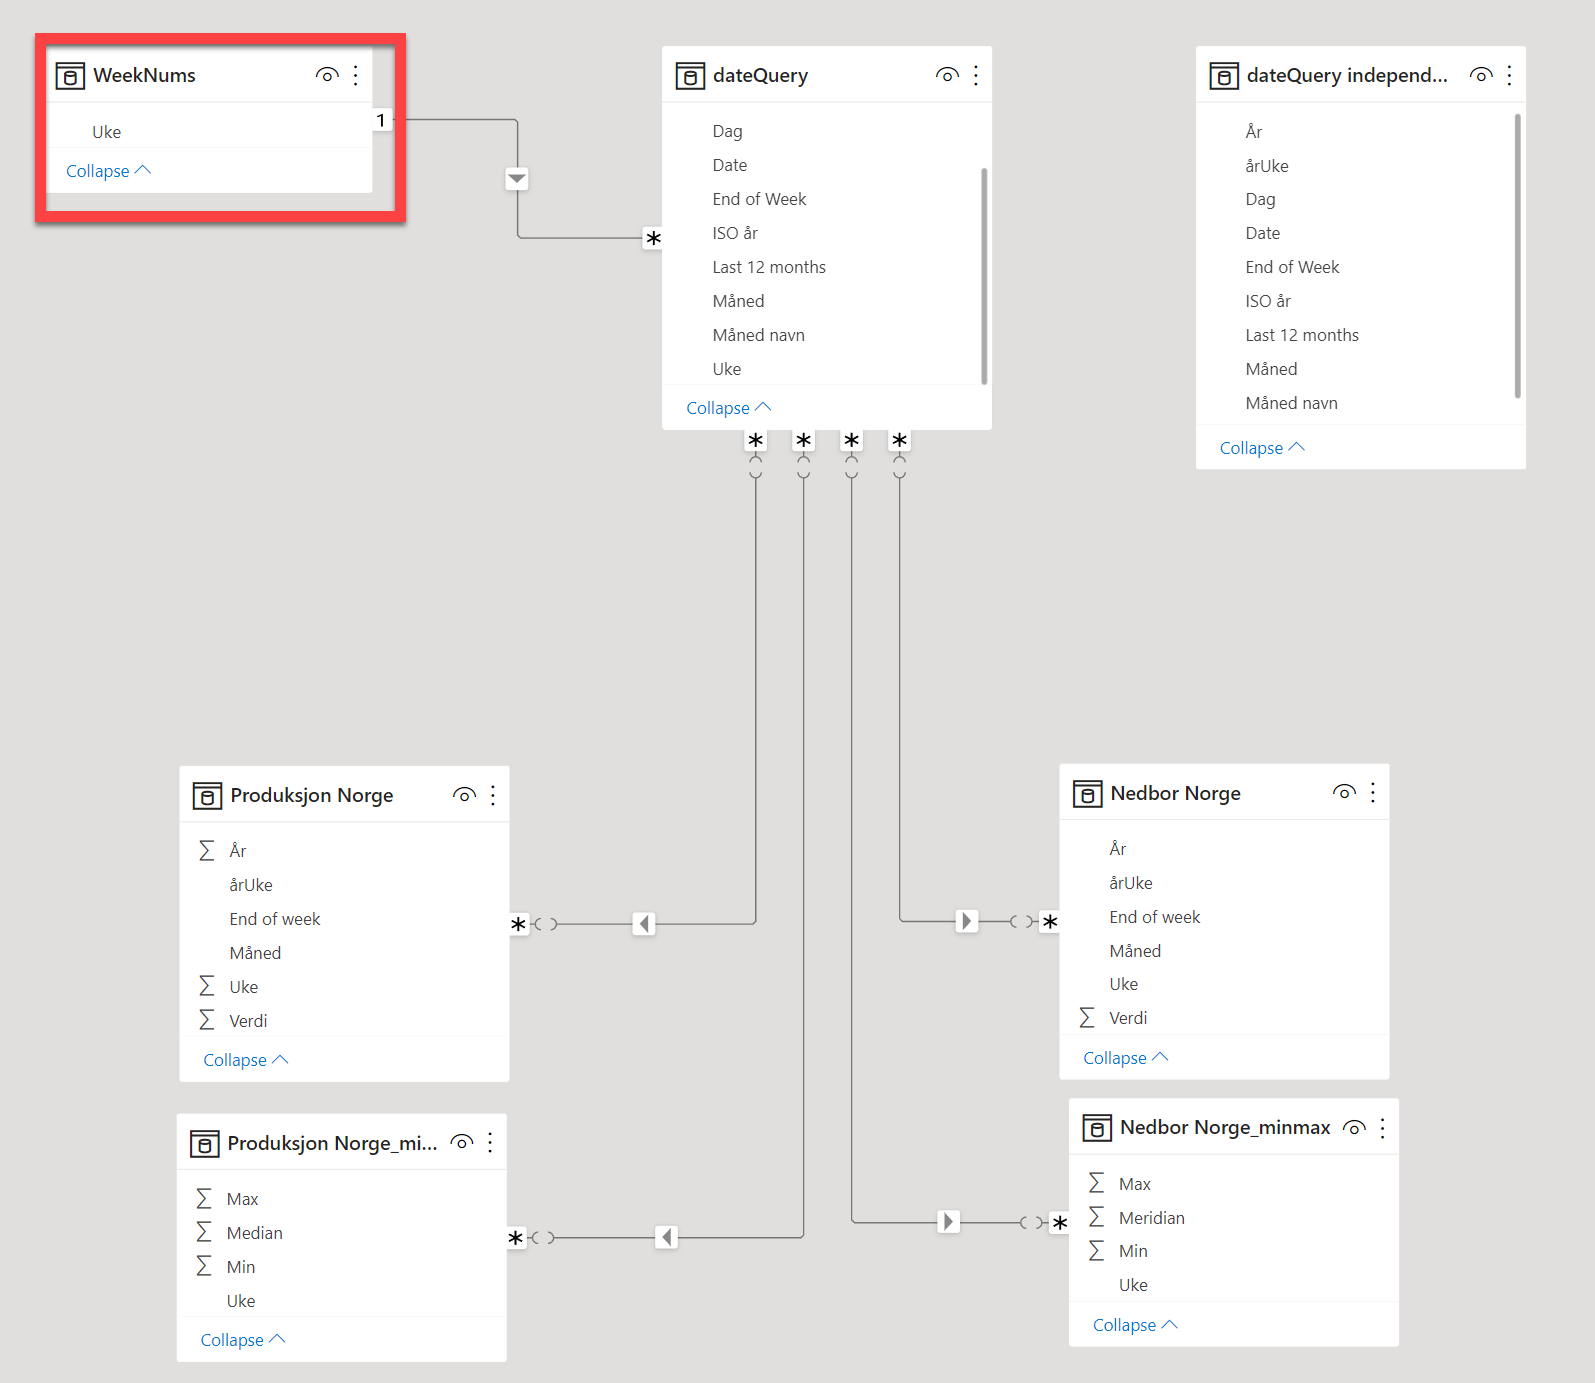
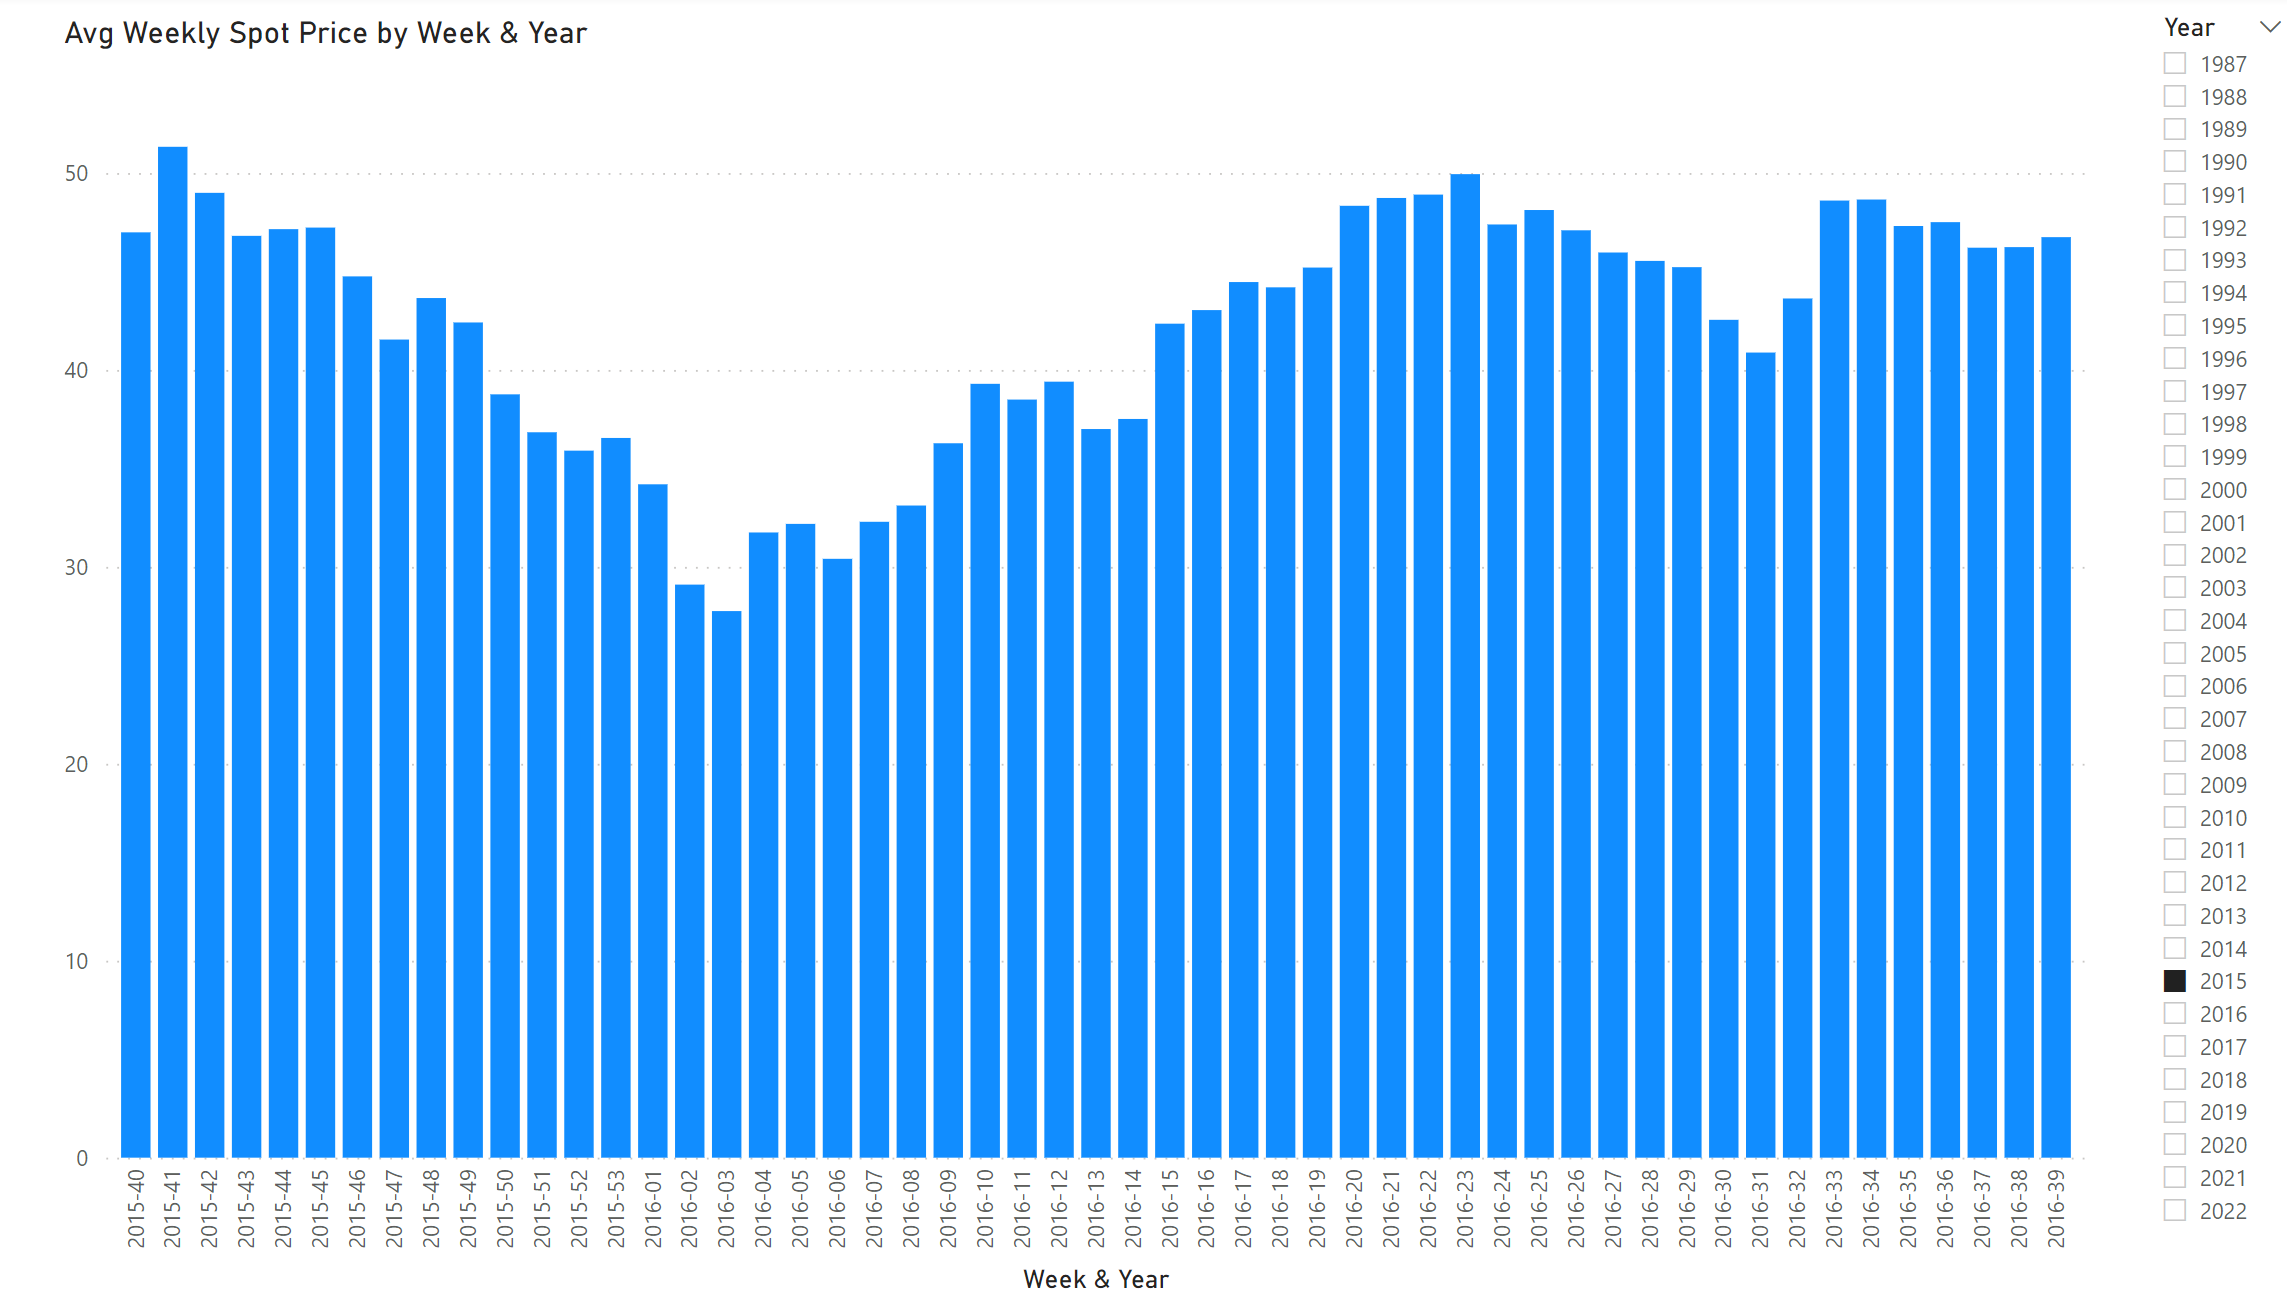
I was having some difficulty with translation and the multiple date tables in your PBIX file, so I created a stripped down example using 35 years of weekly oil spot prices per BBL to show the solution approach for the Week 40 start question.
The solution basically calculates the week offset corresponding to week 40 of the selected year, then calculates the offset corresponding to week 39 of the subsequent year, and then filters the visual down to only those data points with an offset between those two points. Here’s the DAX measure that does the filtering in the visual filter pane:
Within Range =

VAR SelYr = SELECTEDVALUE( 'Disconn Years'[Year] )

VAR CurrWkOffset =
CALCULATE(
    MAX( Dates[WeekOffset] ),
    FILTER(
        ALL( Dates ),
        Dates[ISO Weeknumber] = 40 &&
        Dates[Year] = SelYr
    )
)

VAR Per39WkOffset =
CALCULATE(
    MAX( Dates[WeekOffset] ),
    FILTER(
        ALL( Dates ),
        Dates[ISO Weeknumber] = 39 &&
        Dates[Year] = SelYr + 1
    )
)

VAR Result =
IF(
    SELECTEDVALUE( Dates[WeekOffset] ) >=  CurrWkOffset &&
    SELECTEDVALUE( Dates[WeekOffset] ) <=  Per39WkOffset,
    1,
    0
)

RETURN Result
Note that the slicer values come from a disconnected table to keep from filtering the visual, since the visual will always span 2 years.
I hope this is helpful. Full solution file attached.
Hello @Irina, it’s been a while since we got a response from you. In case there won’t be any activity on it in the next few days, we’ll be tagging this post as Solved.
Hi Brian. Thank you for the solution. I understand the logic. But I am not sure how to make it work for my model. I will try when i come back from vacation.
Thank you again. Appreciate it.
Hi @Irina, due to inactivity, a response on this post has been tagged as “Solution”. If you have a follow question or concern related to this topic, please remove the Solution tag first by clicking the three dots beside Reply and then untick the check box.
Hi, thank you for follow up.
I made it work with the solution Brian suggested, but it works only for the year in the slicer. It will not work if i need to compare 3 years at a time, and it wont work for cummulative, YTD.