Below is a dax code which is creating virtual table with 6 columns.
Define
VAR A =
ADDCOLUMNS (
CROSSJOIN( SUMMARIZE( Destinations, Destinations[Dest]),SUMMARIZE(‘Material Master’,‘Material Master’[Material])),
“Forecast_Act_OrdersQty”, [Order Qty (Combined)],
“Forecast_OrdersQty”, [Supply Forecast(M-3 logic Based on Latest Forecast File)],
“Variance”, [Forecast Variance]
)
VAR B =
ADDCOLUMNS (
A,
“FA_Denominator”,
IF (
[Forecast Variance] > 0,
[Forecast_OrdersQty],
[Forecast_Act_OrdersQty]
)
)
Evaluate
B
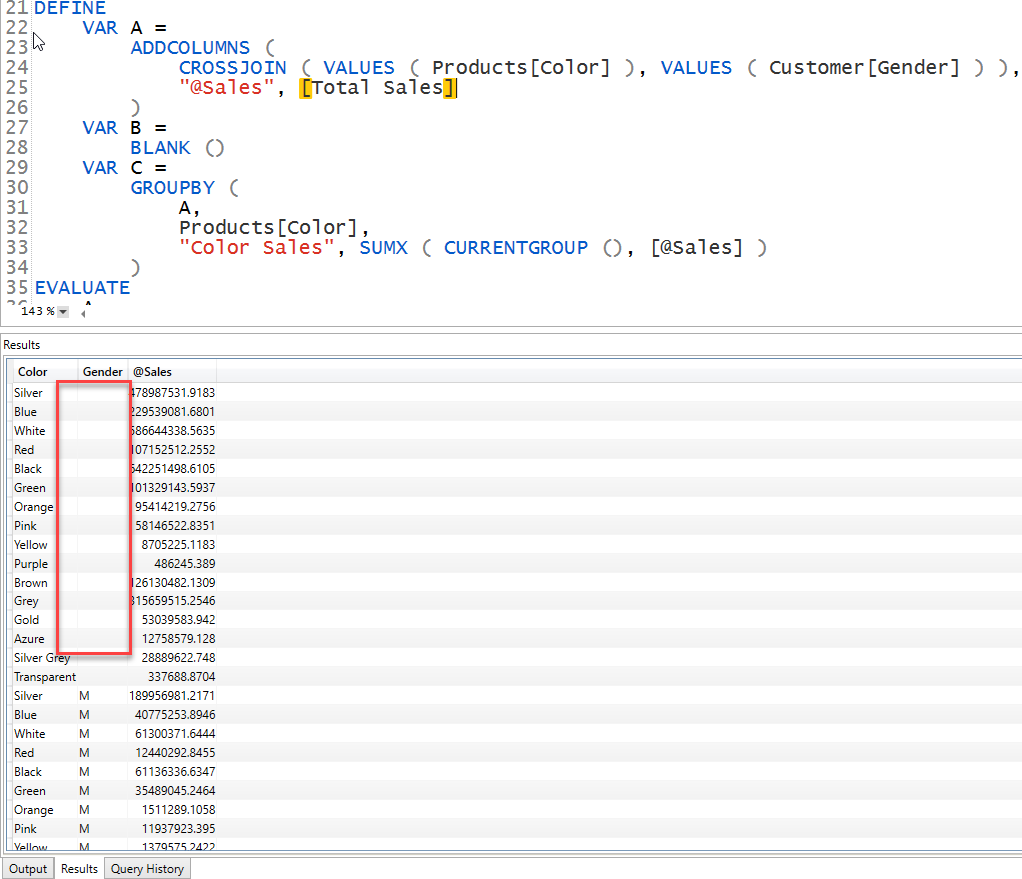
This dax query results in a table with 6 columns in dax studio . I am trying to create another table from the variable B table that will have 3 columns. First Column will be the unique or distinct values of [Dest] Column and the other two column will be the summarization of [Variance] and [FA_Denominator] column as per the [Dest] column.
I have done it using “Table” keyword which was recently introduced but “table” keyword is not working in PBI. It is only working in Dax studio.
Has anyone done anything like this before using variables only??
I do this all the time in my forum solutions. Rather than writing one complex virtual table measure, I break it down into a series of variables so that it’s easier to follow the thought flow behind the solution.
So in your case you can call VAR B as the table argument in a subsequent SUMMARIZE command:
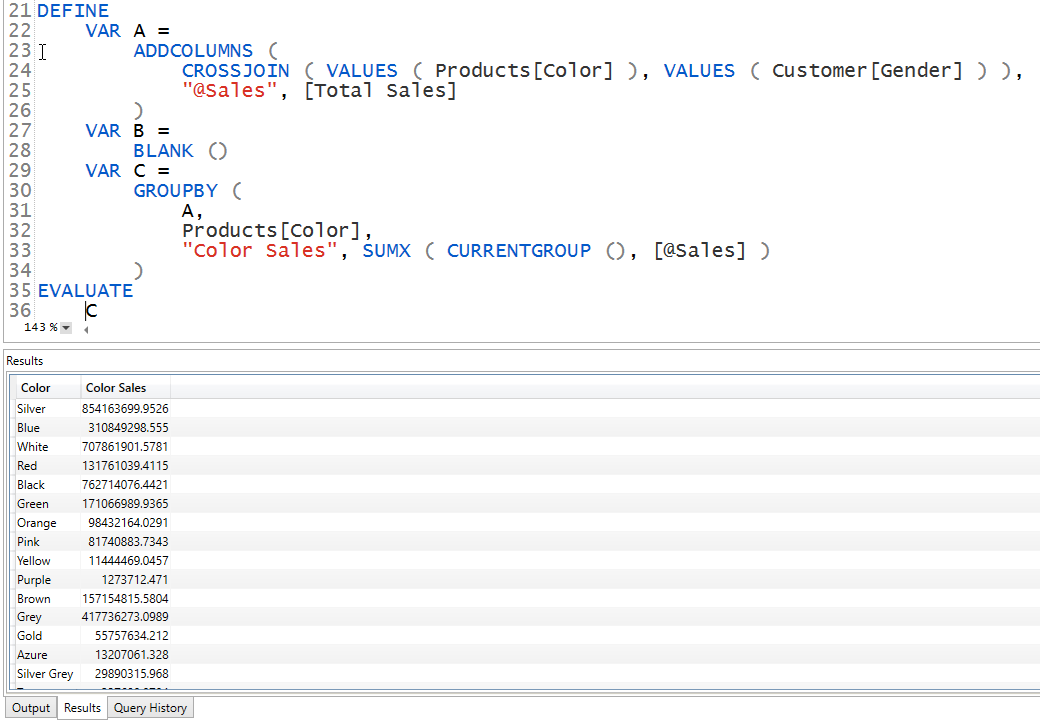
VAR C =
SUMMARIZE(
     VAR B,
     Destinations[Dest],
     [Variance],
     [FA Denominator]
)
Two other things will help here:
Format your DAX! (as Marco Russo says, "if it’s not formatted, it’s not DAX)
Use the @ convention to distinguish virtual table columns from measures (see article below):
First of all missed you guys and this forum a lot. Was away on a tour hence stayed away from this fantastic forum for quite sometime.
@BrianJ,
The way you are summarizing the variable will summarize 3 columns simultaneously. In other words you will have multiple rows and the values in the [Dest] column will be repeated but each row will be unique. The result i am expecting cannot be achieved with this way of summarization. Also,my apologies that i didn’t format the code before posting. Point well noted and will keep in mind for future posts.
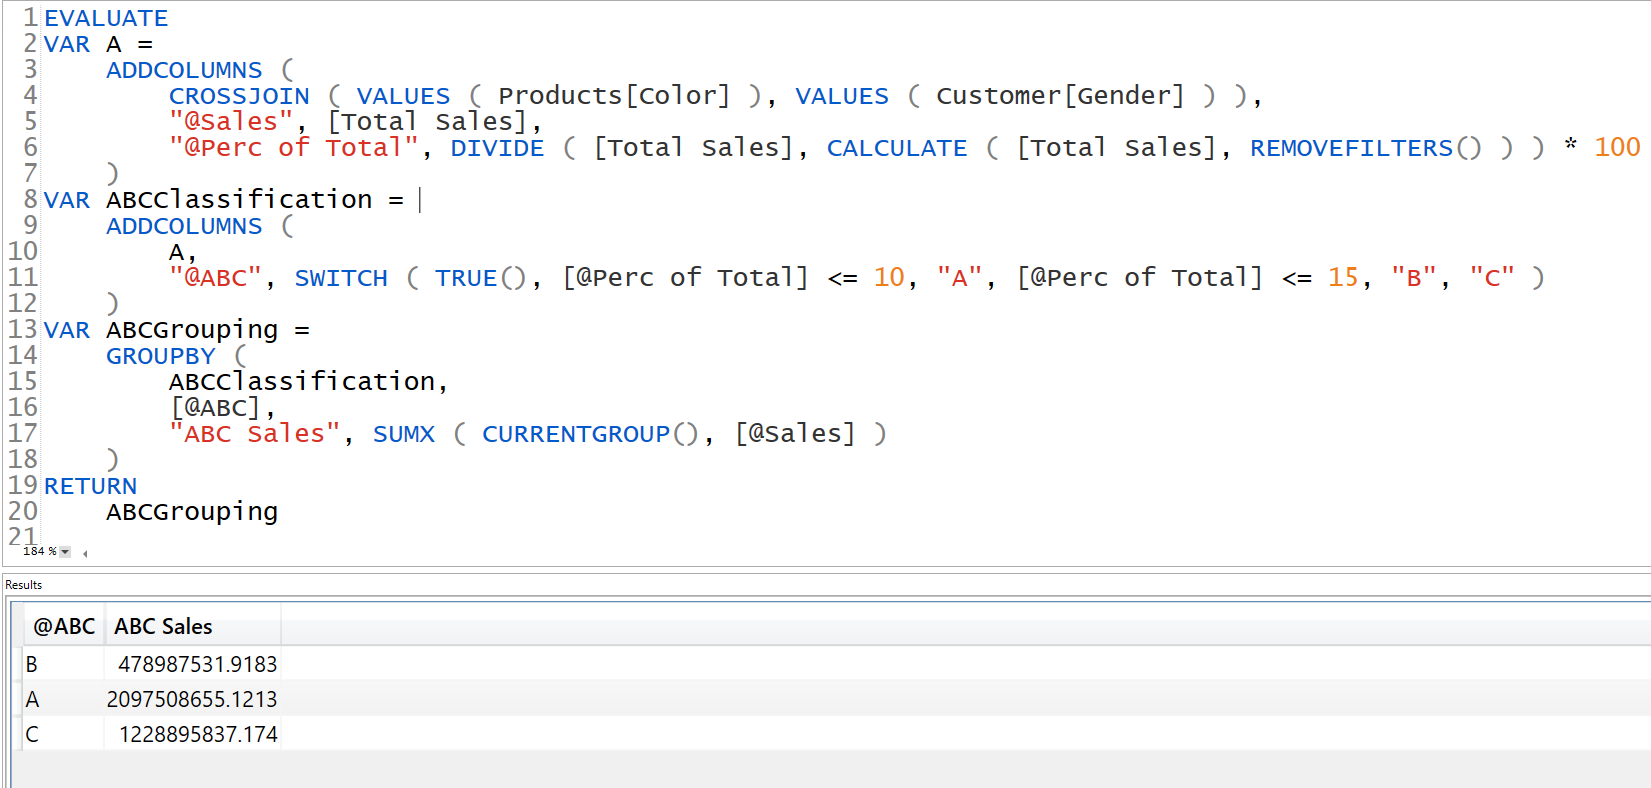
@AntrikshSharma
The way you have summarized the virtual table and the corresponding result is something I believe can be used to complete the scenario i am trying to solve.