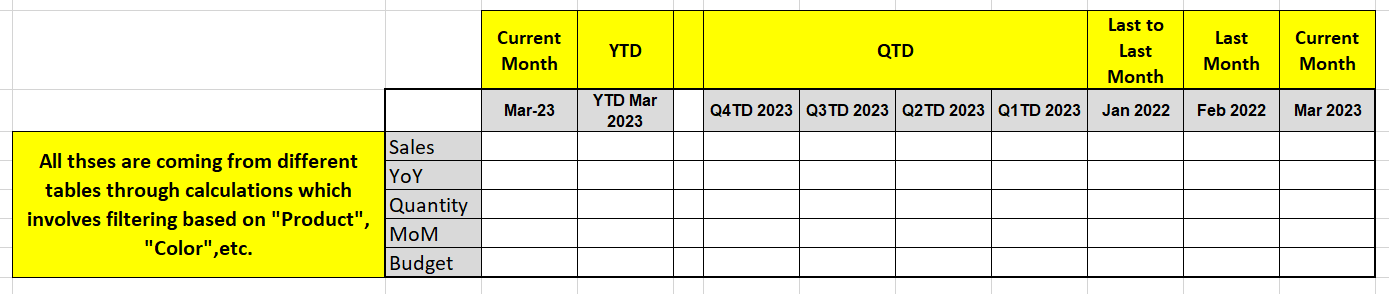
Is it possible to create the Dynamic matrix with custom date fields? I came across the issue where i need to pull the multiple measures into the matrix where they needs to plotted over different custom date columns. For reference please find the below excel table which is the replica of a table i need to build in Power BI.
I noticed you didn’t provide a PBIX file. Providing one will help users and experts find a solution to your inquiry faster and better.
A perfect initial question includes all of the following:
A clear explanation of the problem you are experiencing
A mockup of the results you want to achieve
Your current work-in-progress PBIX file
Your underlying data file (to allow us to go into Power Query if necessary to transform your data and/or data model – often DAX questions really end up being data modeling solutions)
Please also check the How To Mask Sensitive Data thread for some tips on how to mask your pbix file. Not completing your data may sometimes cause delay in getting an answer.
This is not only possible within Power BI, but it’s not that difficult as long as you have the flexibility to use an HTML-based custom visual like VizCreator Cert or VizCreator Flex, and an online HTML table creator tool called DivTable Styler.
This post I did on LinkedIn a number of months ago explains exactly how to do it.
Also, if you download the sample report from AppPSource, @PascalKiefer has a number of examples you can follow, as well as a YouTube video on how to use Excel rather than DivTable Styler to write the bulk of your HTML code for you.
Yes, to some extent i’m able to solve the problem. But i’m not able to add more than 5 rows into the table. Do we have any solution for this. To get more understanding i’ve attached the layout, PBIX and HTML code here.