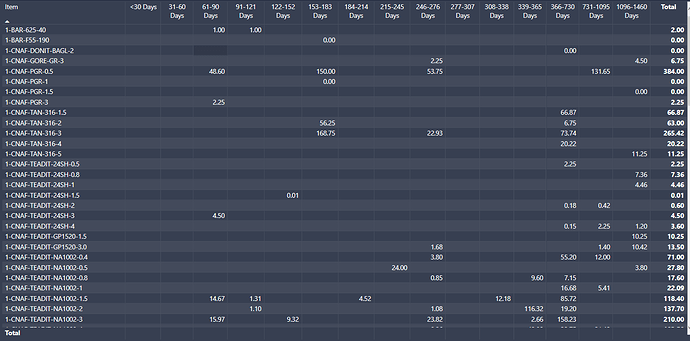
Hi,
I am working on a report that will calculate inventory ageing similar to Sam’s Receivables report from years ago that will sort each item by age of the onhand quantity. Our part numbers are not serialized so the way we are expected to output this data is by taking the onhand quantity and spreading it across purchases starting with the most recent until the amount of purchases equals the amount onhand. The date of the purchase(s) is then used to calculate the age of the inventory onhand by part number based on the amount that was purchased. Below is a simple example.
As of Date 7-Sep-2022
Quantity On Hand 10
Purchases Date Purchases Amount Purchased Days Old Quantity Onhand Age
PO 123 31-Aug-2022 5 7 5 @ 7 Days
PO 124 15-Jul-2022 3 54 3 @ 54 Days
PO 125 28-Jun-2022 5 71 2@ 71 Days
I actually have the report working as long as you require the information from whatever today’s date is. My problem is sometimes they will ask to see a snapshot of the inventory ageing from a prior date. Unfortunately, I have not figured out how to accomplish this. If for example a date is selected prior to today, the buckets simply drop from the table instead of all calculations evaluating from the selected date. Also the quantity on hand will be wrong.
I have attached a sample output of the buckets, a part number to see how the data comes in, and a portion of another table that I use to only include purchases and not issuances. For this exercise, we assume any positive number is a purchase (except “Stock Return” transactions) and subject to covering the age of the inventory even if the transaction type is a transfer or adjustment.
My thought process (Ranking Table.xlsx) was to have a running total of the purchases and subtract that from the quantity on hand assuming the same quantity on hand value was on every row. Once that subtraction resulted in a negative number then I would know the total on hand was smaller than the amount of purchases and therefore the age of the inventory could be determined. I did have to create a couple more calculated columns to get the last subtraction value since the purchase amount could be larger than the remaining balance of on hand quantity and the output needs to sum up to the inventory on hand. Once all amounts and dates are known then I run something similar to the following formula for segregation into the required buckets. (I have messed with the report a million times trying to get it to work so the formula has changed numerous times)
Quantity per Group =
VAR Onhand =
SELECTEDVALUE ( 'Ranking Table'[On Hand] )
RETURN
IF (

    Onhand = 0,

    BLANK (),

    CALCULATE (

        SUMX ( 'Ranking Table', 'Ranking Table'[Final Quantity Clean] ),

        FILTER (

            ( 'Ranking Table' ),

            COUNTROWS (

                FILTER (

                    Buckets,

                    'Ranking Table'[Days Old] >= Buckets[Min]

                        && 'Ranking Table'[Days Old] <= Buckets[Max]

                )

            ) > 0

        )

    )

)
What I have done though will not filter by date if someone wanted to look at the inventory at any point in the past. I would also rather use the Example.xlsx for the calculations but started off the report thinking it would be better if I only had a table with “purchases” or positive numbers.
I guess in summary, I am trying to create a running total of inventory quantity on hand that could be filtered by date so that the on hand quantity would reflect that date. Not hard at all. What I can’t figure out is how to apply that on hand quantity across the most recent purchases (positive numbers) depending on the date selected by the user and properly segregate the on hand quantity at that time into buckets.
Any ideas are greatly appreciated in advance. Unfortunately, I don’t work with Power BI everyday like some do, therefore, my knowledge is limited. If any additional information is required, let me know. Also, sadly, I cannot post the pbx file. If that prohibits any help with this problem, I certainly understand.
Buckets.xlsx (9.2 KB)
Example.xlsx (58.1 KB)
Ranking Table.xlsx (11.2 KB)
