Intersect Virtual Table Grand Total

Hello,

Is it possible to sum the monthly results in a grand total for a formula using intersect?

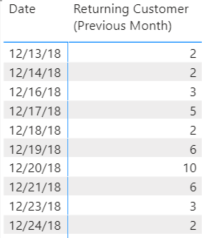
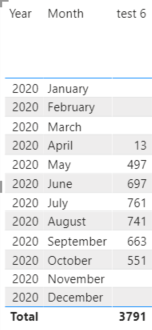
I have this result from an intersect evaluated monthly:
image

Problem
but the grand total is not the sum of the months. I tried EVERYTHING! I can’t get the Sumx or AverageX to produce a sensible result.

while I understand these are iterating functions, I don’t understand why it won’t work if I use a virtual table:

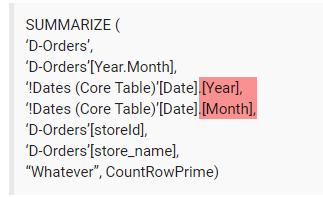
SUMMARIZE (
‘D-Orders’,
‘D-Orders’[Year.Month],
‘!Dates (Core Table)’[Date].[Year],
‘!Dates (Core Table)’[Date].[Month],
‘D-Orders’[storeId],
‘D-Orders’[store_name],
“Whatever”, CountRowPrime)

Background Formulas:

VAR PrevUSERTBL = CALCULATETABLE(VALUES(‘D-Orders’[customerId]),DATEADD(‘!Dates (Core Table)’[Date].[Date],-1,MONTH))

Var CurrentUserTBL =CALCULATETABLE(VALUES(‘D-Orders’[customerId]),FILTER(‘!Dates (Core Table)’,‘!Dates (Core Table)’[Date]<=MAX(‘!Dates (Core Table)’[Date])))

Var PreviousMonthCrossReference = INTERSECT(CurrentUserTBL,PrevUSERTBL)

var CountRowPrime = COUNTROWS(PreviousMonthCrossReference)

RETURN


AVERAGEX(STable,[Whatever])


//this is the formula that creates the result in the firt image

Background Context
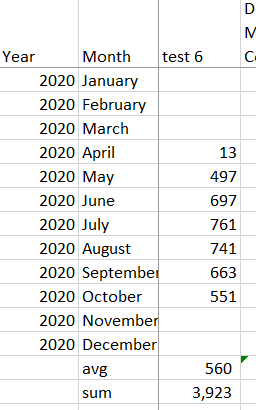
I used the intersect formula from the Var tables listed above to see how many customers return in the next month (consecutive month purchasers). In aggregate, I would like to determine what that amount is on average YTD. Or even the Sum YTD.

I was able to do this in excel easily but dax???
image

Hi @Swhs24,

I would be happy to look into this for you but please provide a sample PBIX file
Thanks

My files are far too big to trim and post. I will try to create an alternative sample file that meets your file limits but in the meanwhile, the question is conceptionally can a sum or average grand total be performed on the intersect function?

Every demo video I’ve seen in the internet including ones from EDNA don’t have accurate grand totals with the intersect function. So it’s not just a question of my modeling, I’m wondering if it’s possible at all?

Hi @Swhs24,

Okay so I’ve put something together, see how you get on with this.
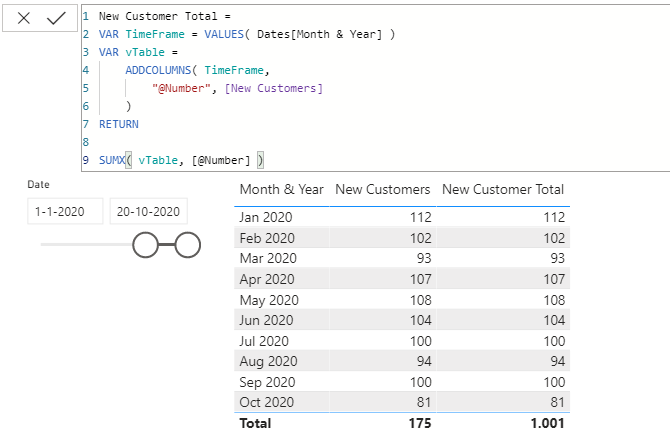
The base measure is the same and looks like this.

New Customers = 
VAR NewCustomers = VALUES(Sales[Customer Name Index] )
VAR PrevCustomers = CALCULATETABLE( VALUES( Sales[Customer Name Index] ), DATEADD( Dates[Date], -1, MONTH ))
RETURN

COUNTROWS(
    INTERSECT( PrevCustomers, NewCustomers )
)

.
Then I used measure branching to iterate over a virtual table of the Months and Years.
With this result.

image

Here’s my sample file. eDNA - New Customers with Totals.pbix (573.5 KB)
I hope this is helpful.

2 Likes

Melissa, this is brilliant. Works perfectly! I spent so many hours trying everything I knew. While I am excited to have the solution I’m still trying to fully understand the technique.

Do you have any idea why the function “values” on the Month & Year or “summarize” didn’t work?

Also, it appears that time intelligence calcs like running totals or previous months values (eg Dateadd tblX, - 1, Month) functions don’t seem to work in virtual tables either. I could not find any resources to confirm that but it was my experience. Any insights?

As you can see I also used VALUES but I suspect there’s another issue…
(please read on)

In your initial post I noticed that you have Auto Date/Time enabled and are leveraging of it, that is never a good idea and can cause all sorts of issues. This can also explain in part why your file size is larger than it ought to be because a separate date table is created for each date field in your model.
image

Recommendations for resolving that:

  1. Turn off Auto Date/Time globally, you will find that in the Options/Data Load menu, this will prevent the creation of Auto Date/Time calendars for all new files you create.
  2. Then also disable it for the current file
  3. Always incorporate a proper Date table if you have a date field anywhere in your datamodel that meets the following requirements needed for Time Intelligence functions to work properly:
  • Must have a column of data type date (or date/time )—known as the date column
  • The date column must contain unique values
  • The date column must not contain BLANKs
  • The date column must not have any missing dates
  • The date column must span full years. Where a year isn’t necessarily a calendar year (January-December). And cover all dates from the earliest- to the last date present in your dataset.
  • The date table must be marked as a date table
  1. Finally you wil need to amend all your Measures (and/or Calculated Columns) accordingly.

I hope this is helpful.

If there is a way to get you to see the actual model I would love to share but even a zip does not help to meet the file size limit.

While I follow your points conceptually, I’m not fully clear practically. For instance, you advise that I have a date table which I do. In fact, I imported the data table directly from a file and instructions provided from ENDA. Although, today I did right-click and select “Mark as Data Table” and updated my formulas accordingly.

Once I implemented that change, as you cautioned my views broke, nothing with this date table function works unless I display at the contiguous “Date” level rather than grouped by Year or Month; this is confusing and non useful behavior; am I missing something. At lease with the date hiearchy (which is now gone) I could summarize information in date groups.

image

Don’t get me wrong but its a good sign that the automatic hierarchy is gone :wink:

You can easily create your own for example (go to your Dates table):
drag and drop Quarter on to the Year field, you’ve now created a Year hierarchy
drag and drop the MonthName to this new hierarchy next, you now have a next level
just keep repeating this process until you have the hierarchy you want - you can rename it too

Apologize for the many follow-up but the more I adopt your recommendations (which are working) I have un-intended consequences dragging me from my depth. I successfully recreated my own hierarchy.

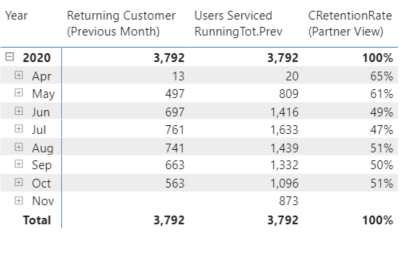
I am attempting to apply the original successful “virtual table” technique to this formula but it does not appropriately average the months in the Grand Total as expected:

CRetentionRate(Partner View) =

VAR RetentionMoMLossTechnique = DIVIDE([Returning Customer (Previous Month)],[Users Serviced RunningTot.Prev])
VAR TimeFrame = VALUES(‘!Dates (Core Table)’[Year.Month])
VAR VTable =
ADDCOLUMNS(TimeFrame,“@Number”,RetentionMoMLossTechnique)

Return
AVERAGEX(VTable,RetentionMoMLossTechnique)

image

I understand, no worries.

Can you show me your Date table fields?
Just copy a few lines to Excel so I can see the Column names, values and data types.

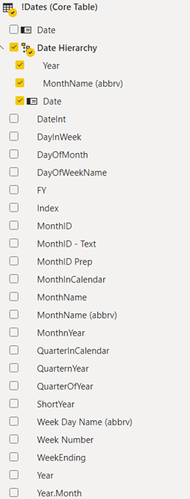
Here’s the full list:

Thanks but I also need to see what values are associated with the names…

First half of table:

Second:
image

Perfect. So I might have overlooked something obvious here, your are not averaging the [@Number] column from the vTable…

Secondly, try measure branching:

RetentionMoMLossTechnique = 
DIVIDE([Returning Customer (Previous Month)], [Users Serviced RunningTot.Prev])

.

CRetentionRate(Partner View) =
VAR TimeFrame = VALUES('!Dates (Core Table)'[Year.Month])
VAR VTable =
ADDCOLUMNS(TimeFrame,"@Number", [RetentionMoMLossTechnique] )

Return
AVERAGEX(VTable, [@Number])

.

Should this all fail, please create a new topic and supply a small sample in PBIX, here are some tips for masking and limiting data.

Done and worked.

Why? What’s the difference in how the formula is processed via measure branching vs virtual table calc?

That seemed to be the breakthrough. I’m applying these concepts and getting varied results.

The short answer is context transition… You might want to use the Search option in the top right to research relevant content on that subject, when you are ready.

1 Like