Dear Enterprise DNA forum,
I would like to ask your help to find a solution to this little problem. I am working with a very basic dataset about the top 10 tennis players ranking over a number of years. Just 3 columns: Year, Player, Ranking (1 to 10). Some players appear for many years, often with different ranking, some just once.
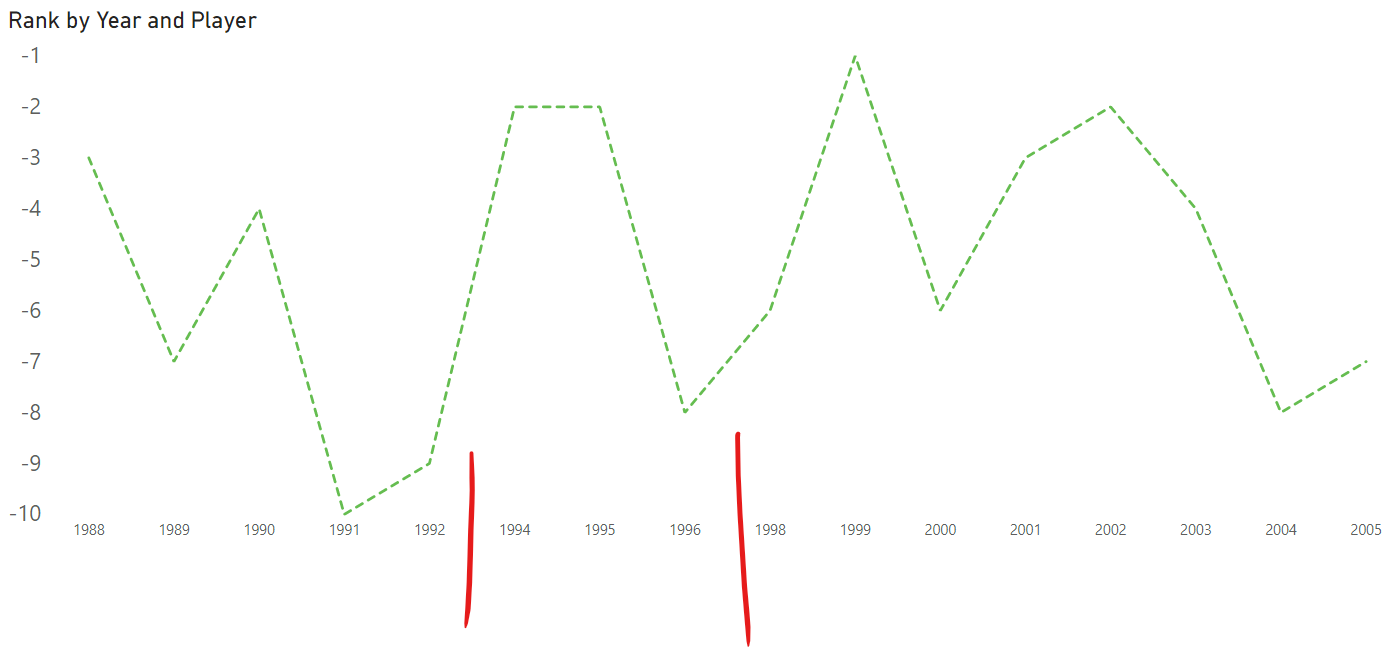
In my exercise, I am preparing a line chart visualization to show how their presence in the Top 10 evolved over the time they have been in (Year on the X and Ranking on the Y). For some players, their presence in the Top10 is not continuous, for example this one:
How can I make sure the line chart is discontinued for those years? What Power BI seems to naturally do is just interpolating between the two closest years, like here:
Thanks a lot in advance, really appreciate your support
Ciao
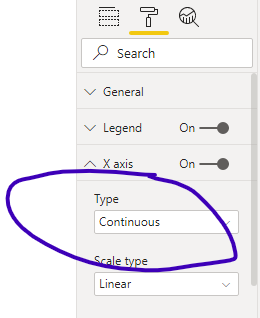
Hi @Anferrig, try setting the X axis type to Categorical instead of Continuous.
Hi @marcster_uk, thanks a lot for your reply,
In the view I posted the X axis type is already set on categorical , and it has basically two effects:
-
when only one player is selected, it shows in the X only the years which have values for him, maybe I am doing something wrong there, but the line is continuous
-
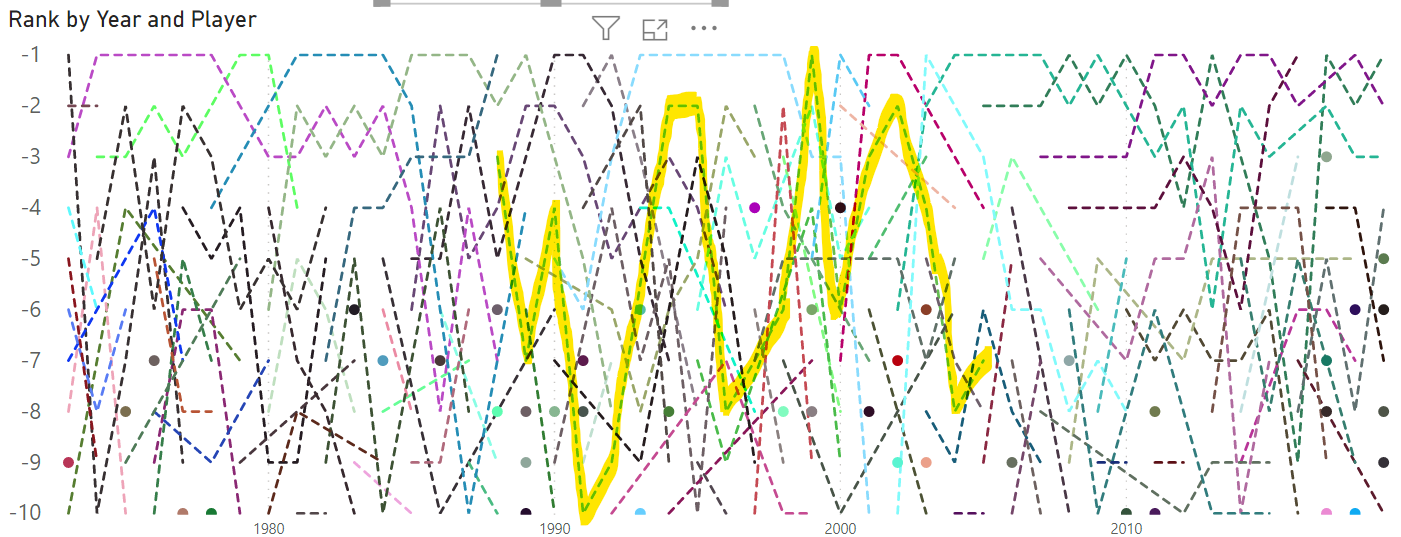
when all the players are selected, all the years are present in the X and the line is discountinued (as I was aiming) but a number of players are not shown. Actually there must be 10 players per year as in the dataset
-
here the view with all the players and X axis set on continuous, the line is continuous but all players shown
My goal is to have discontinued lines, all players and all the years in the X axis also only when one player is selected (This last point probably would solve all the issue as could keep categorical)
Once again, a big thanks for everyone’s support
Ciao
What does the table of this data look like?
Have you tried converting the column shown in the line chart to continuous variable using Power Query?
Hi @ctvv3010,
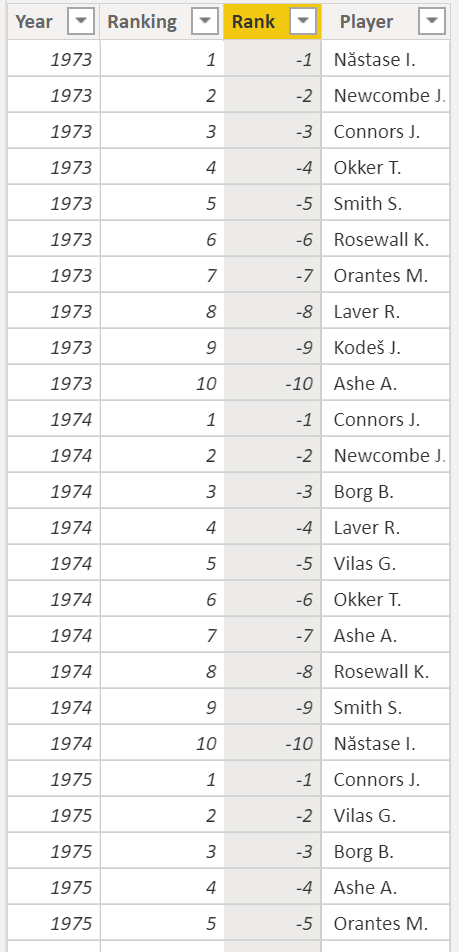
thanks a lot, for your support, here an extract of the data table:
The Rank is a calculated column (-Ranking) the rest is from the original table.
What do you mean by converting the column shown in the line chart to continuous variable using Power Query?
Thanks a lot
Ciao
Thanks for posting your question @Anferrig. To receive a resolution in a timely manner please make sure that you provide all the necessary details on this thread.
Here is a potential list of additional information to include in this thread; demo pbix file, images of the entire scenario you are dealing with, screenshot of the data model, details of how you want to visualize a result, and any other supporting links and details.
Including all of the above will likely enable a quick solution to your question.
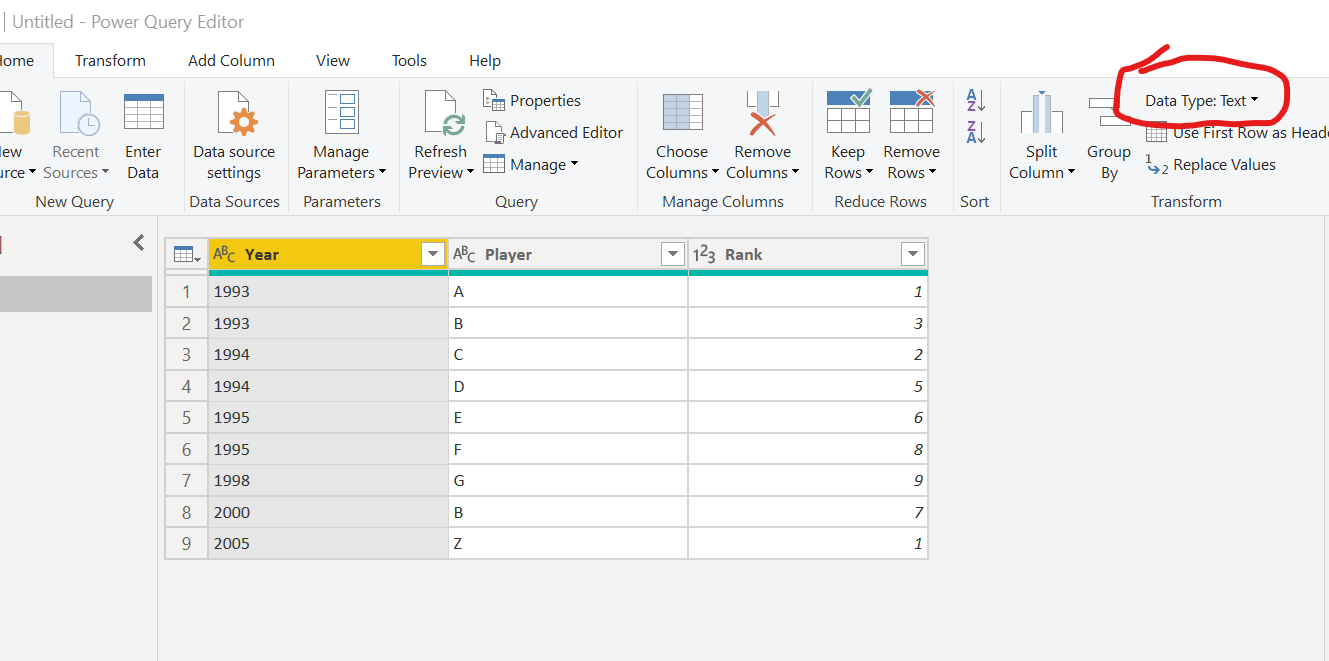
Hmm. You might need to convert the year column to Text:
This should solve your problem, I hope.
Hi @Anferrig, we’ve noticed that no response has been received from you since the 16th of April. We just want to check if you still need further help with this post? In case there won’t be any activity on it in the next few days, we’ll be tagging this post as Solved. If you have a follow question or concern related to this topic, please remove the Solution tag first by clicking the three dots beside Reply and then untick the checkbox. Thanks!
Hello,
Well, I am still trying to sort it out and make the proposed solution work. Actually I still haven’t managed, but before asking for further help, would like to be sure that I am doing everything correctly.
Will come back on this shortly
Thanks a lot and sorry for the delay