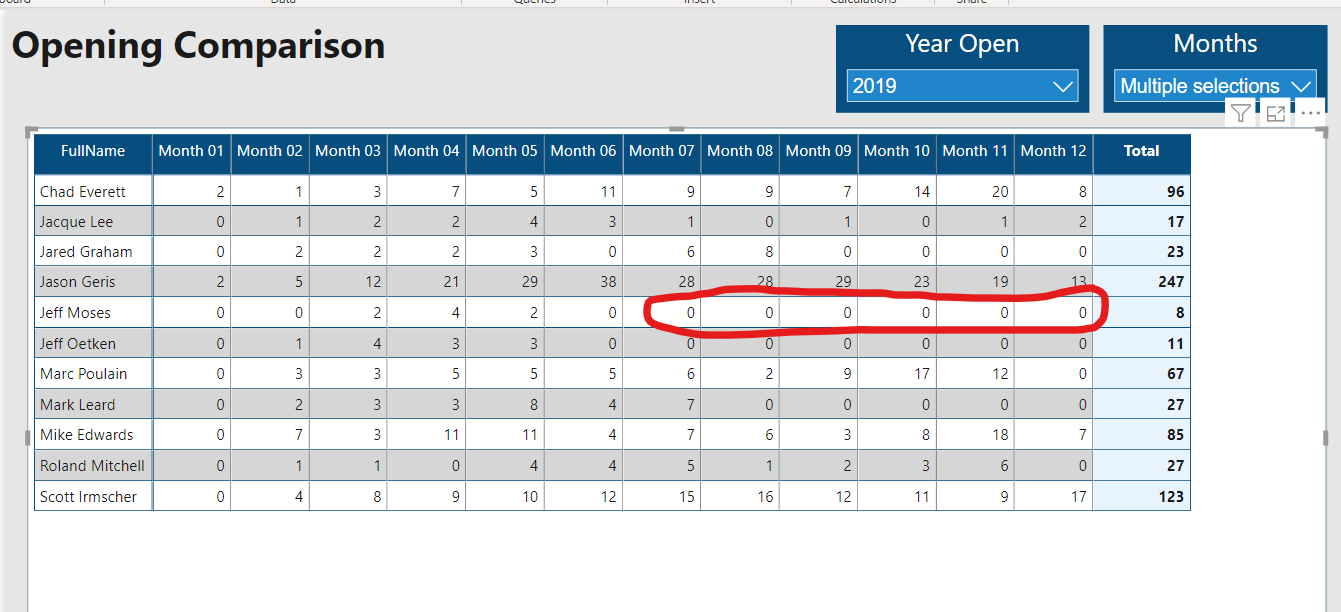
I have a matrix that displays the number of inspections for the first 12 months a franchise is open against the first 12 months of other franchises, regardless of when they opened (see chart below). I want to display a zero in the blank fields in a Matrix but only for actual months they are open. The issue I have is I only want a zero in the months they have actually been open. If i use the ‘+0’, it will put a zero in all months that have a blank. For example:
in the chart below, Jeff Moses is actually in his 8th month open. Month 7 and 8 should be zero. Month 9 thru 12 should be blank. This allows us to quickly look to see if a new franchise might need attention because they shouldn’t post a zero after being open for a few months.
In general terms, I would create measure with a variable that captures the opening year and month for each FullName. Then use a SWITCH(TRUE()) construct to return the inspection value or 0 if the variable is less than or equal to the selected year and month based on the filter context from the slicer and the evaluation context from the matrix visual (i.e., they were open prior to the selected month) and the selected year and month is less than or equal to the current month, and a blank otherwise.
In other words, test these 3 conditions with the SWITCH(TRUE) in this order:
Is the selected month in the future (return blank)
Were they not open in the selected month? (return blank)
Did they have no inspections in the selected month (return 0)
All else, return # of inspections.
Then you could conditionally format the zeroes to make them stand out.
Happy to provide the specific DAX if you can provide a PBIX file.
Thanks for the PBIX. Can you also please post the CSV file?
I can tell right away that before we dig into the DAX, we need to do some substantial revision to the data model to transform it into a star schema compliant model that will make the DAX much, much easier, more efficient and most importantly, ensure it returns accurate results.
Thanks for posting your question @ChrisZimmerman. To receive a resolution in a timely manner please make sure that you provide all the necessary details on this thread.
Here is a potential list of additional information to include in this thread; demo file, images of the entire scenario you are dealing with, screenshot of the data model, details of how you want to visualize a result, and any other supporting links and details.
Including all of the above will likely enable a quick solution to your question.
Great – thanks for sending these along. I’ll try to have a reworked data model and a solution to your initial question back to you later this evening.
UPDATE: I’ve reworked the data model and written the necessary measures. Have one bug in a key measure to squash, and then should have a good solution for you. Calling it a night - should have this done for you tomorrow,
OK, I think I’ve got this working in a way that meets your requirements.
The first thing I did was rework your data model into a standard star schema by combining the Zoho Accounts and Zoho Contacts and removing the resulting duplication, getting rid of the unnecessary bidirectional relationships and the bridge table. I suspect you had the bidirectional relationships set up in order to sync the slicers on those two tables. However, especially given the large amount duplication between those tables, de-normalizing them into one table accomplishes the same thing and allows us to get rid of the undesirable bidirectional relationships. I also had to add a dimension table for Display Month, used in both the slicer and to get the matrix to calculate properly. Here’s the resulting data model following these changes:
Now the measures to calculate the matrix values and to do the conditional formatting of the matrix values become pretty straightforward and allow us to distinguish both computationally and visually between zeros and blanks:
I think the way you’ve the structured cross-time/cross-franchise comparisons is very clever, and I enjoyed working through logic of it. With the conditional formatting applied, the underperforming franchises jump right off the page.
I hope this is helpful to you. Full solution file attached.
Hi @ChrisZimmerman, a response on this post has been tagged as “Solution”. If you have a follow question or concern related to this topic, please remove the Solution tag first by clicking the three dots beside Reply and then untick the check box. Thanks!