Incorrect Total

I have a DAX measure where i need to sum up all quantities started for a particular drawing number.

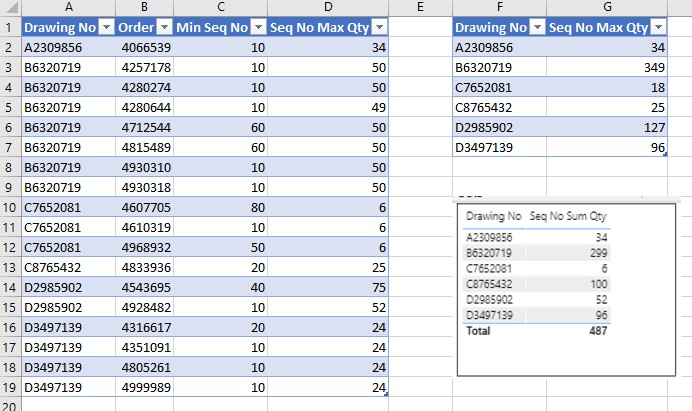
First i determine the lowest (minimum) seq no for a production order (Order) linked to a specific Drawing No, the image below shows this.

Production Min Seq No

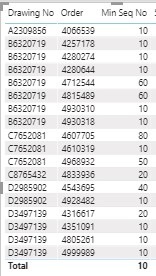
The DAX measure for Min Seq No is as follows

Min Seq No = MIN( 'Production'[Seq No])

I then determine what the Maximum quantity that has started for a particular Production order and Seq no.

Production SeqNo Max Qty

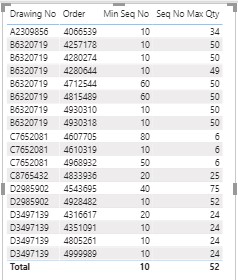
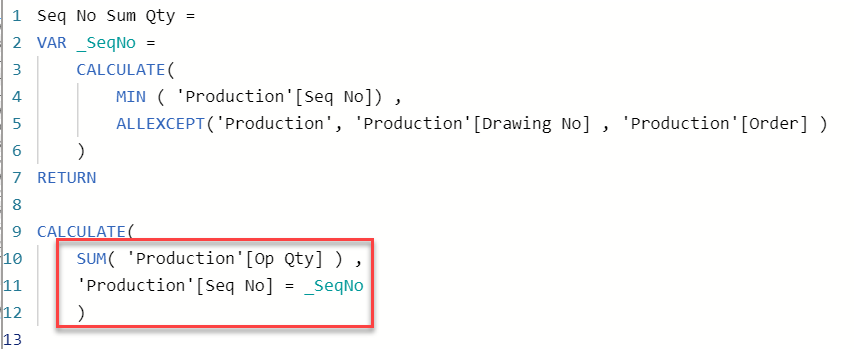
The DAX measure for Seq No Max Qty is

Seq No Max Qty = 
VAR _SeqNo = 
    CALCULATE( 
        MIN ( 'Production'[Seq No]) ,
        ALLEXCEPT('Production', 'Production'[Drawing No] , 'Production'[Order] )
    )
RETURN

CALCULATE(
    MAX( 'Production'[Op Qty] ) ,
        FILTER ( 
            ALLEXCEPT( 'Production' , 'Production'[Drawing No] , 'Production'[Order]) ,
        'Production'[Seq No] = _SeqNo 
    )
)

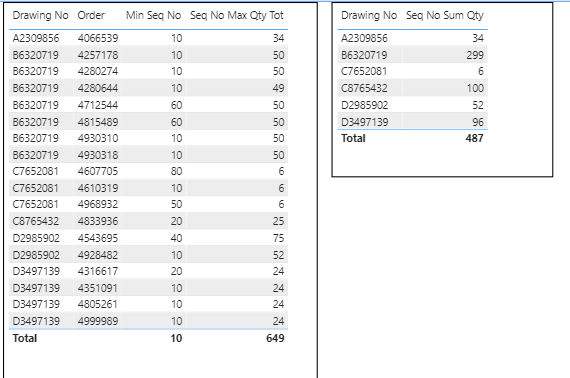
The DAX measure appears to be returning the correct result. Although curiously the Total row is only showing a total of 52, any thoughts why?

When i now want to reduce the context to just Drawing Number only i do not get the desired result

Production SeqNo Sum Qty

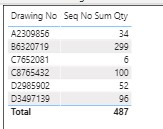
The DAX measure for Seq No Sum Qty is…

Seq No Sum Qty = 
VAR _SeqNo = 
    CALCULATE( 
        MIN ( 'Production'[Seq No]) ,
        ALLEXCEPT('Production', 'Production'[Drawing No] , 'Production'[Order] )
    )
RETURN

CALCULATE(
    SUM( 'Production'[Op Qty] ) ,
        FILTER ( 
            ALLEXCEPT( 'Production' , 'Production'[Drawing No] , 'Production'[Order]) ,
        'Production'[Seq No] = _SeqNo 
    )
)

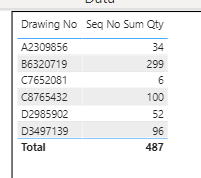
For the DAX measure Seq No Sum Qty on Drawing Number B6320719 returns 299, where using DAX measuren Seq No Max Qty for same Drawing number sums up to 349

I have also provided a sample pbix and the excel file

What am i doing wrong, any help would be greatly appreciated?

Many thanks
J

Production Rev-1.pbix (115.5 KB)

Production Rev-1.xlsx (431.5 KB)

@jprlimey,

Very common problem, given the way Power BI evaluates the total row(s).

eDNA Expert @Greg has put together a fantastic set of resources to help you resolve this issue in the DAX Patterns section. Please take a look at this, and if you still have problems, give a shout…

  • Brian

Brian,

Thank you for your response. i will review that materials you suggest.

The total row was only a small part of this problem. The major problem is that i’m not getting the correct totals for the Drawing number context only. This is my major problem, in the examples above the last image where i show only the Drawing no and the measure, in the visual the total for drawing number B6320719 returns 299, where in actual fact it should be 349. This is not the only one that is returning a wrong result. I must have something wrong with my DAX unless as you say fixing the incorrect totals per the materials you provided will fix the problem.

Thanks
J

@jprlimey,

I’ll be glad to take a closer look at this tonight. One thing that would be very helpful in validating my solution would be if you could please provide a mockup of the full correct results you should be seeing in this visual:

image

Thanks!

  • Brian

Brian,

Thank you so much for taking a second look at this problem, below is an image (the table upper right is what i want as a final product). The image on the bottom right is from Power BI and you can see several mistakes when compared to the upper right image. The image on the left is showing Drawings No, Order No, the Min Seq No (this is also a DAX measure but seems to be correct) and the DAX measure for the Maximum qty that matches Drawing no, Order no and Min Seq no.

I have also attached an Excel file showing all 3 images.

Test Rev-1.xlsx (19.1 KB)

Thanks again
J

1 Like

@jprlimey,

Great! - thanks for the quick response, and for providing a clear explanation of the problem, the PBIX, xlsx and a desired results mockup. That’s definitely the formula for receiving the best support via the forum. WIll get back to you later tonight.

  • Brian

@jprlimey,

OK, I think I’ve got this working per your requirements. I wasn’t sure if you needed a total on Min Seq No, so I left that one for you to fix if needed (it will use the exact same approach I used to fix the total on Seq No Max Qty Tot).

image

First, I made the following change to Seq No Sum Qty, which removed the ALLEXCEPT statements, which were removing the filter context associated with Drawing No, and giving you incorrect results in the second table:

Then in the first table, I changed the Seq No Max Qty measure to Seq No Max Qty Tot and nested the virtual table within the SUMX statement to return the same values for each non-total row but then to correct the total per the explanation in @Greg’s DAX Patterns section referenced above:

Seq No Max Qty Tot = 

SUMX(
    SUMMARIZE(
        Production,
        Drawings[Drawing No],
        Orders[Order]
    ),
    [Seq No Max Qty]
)

Please let me know if that gets you what you need. Full solution file attached below.

Brian,

Thank you for an extremely quick response, yes it appears you have “cracked-it”.

I will now attempt to expand your solution to completed pieces, where i will need to incrementally count the total for each sequence no, of each unique production order, tied to a drawing no.

Obviously, the last sequence number of each production order would be the final production quantity yield, but it would be curious to see the totals at each sequence no, as I’m sure our technicians lack the discipline to transact the completed quantities correctly, thus exposing the “hidden factory”.

I must also mention, i watched your first Problem of the Week, kudo’s to Enterprise DNA for the foresight to provide the unique learning opportunity, congrats to the entire team. Interestingly the current Challenge #10, is somewhat aligned to my line of work, I may even take up the Challenge if time permits.

Thanks again.
J

2 Likes