Incorrect Total - Context Filter - YTD Values

Hello,

I am banging my head with in-correct totals again. I tried HASONEVALUE, SUMX, SUMMARIZE etc. with no avail.

Example:

New Hires * Avg. Salary Variance for Executive is 375* (-12,226) = (-4584,584)

Total should be summation of these 5 rows: - $1,87,21096

but I am getting 12,043*(-7284).

image

I have attempted few formulas: You can search in this file with keyword “Harsh”. but none of them are working.

https://drive.google.com/file/d/1MzfnfMxHUn7AeWdfx5eBo8_SKcsux1B3/view?usp=sharing

TIA,
RK

Hello @rit372002,

Thank You for posting your query onto the Forum.

Isn’t the total of those 5 rows should be ($25,988,110) rather than ($18,721,096). Because upon summing up the numbers based on the condition that you’ve provided i.e., New Hires * Var. New Hires Avg. Salary, it totals to ($25,988,110). Can you please and verify check again?

And based on that condition, below is the measure alongwith the screenshot of the final results provided for the reference to fix the totals by using the same SUMX() - ADDCOLUMN() - SUMMARIZE() method.

# YTD Wage Inflation New Hires - Harsh =
SUMX(
    ADDCOLUMNS(
        SUMMARIZE(
            HRIS_TD_COMP_WAGE_DETAIL_NEWOLD ,
            HRIS_TD_COMP_WAGE_DETAIL_NEWOLD[Global Manager_level_text] ) ,
        "@Totals" ,
        [YTD Wage Inflation New Hires] ) ,
    [@Totals] )

I’m also attaching the working of the PBIX file for the reference purposes.

Hoping you find this useful and meets your requirements that you’ve been looking for.

Thanks and Warm Regards,
Harsh

DNA - Harsh.pbix (8.4 MB)

1 Like

@Harsh: Can’t thank you enough. I am checking it out. For the 2nd table at bottom, I tried to use the same formula concept.

For e.g.: If I take an example of CHINA, 578,019.30 looks right on the top table but other one looks wrong.

Thanks,
EZ

Hello @rit372002,

I didn’t got the example which you mentioned above - “If I take an example of CHINA, 578,019.30 looks right on the top table but other one looks wrong.

What’s showing wrong at the other end? Can you please elaborate a little more on the example?

Thanks and Warm Regards,
Harsh

@Harsh

Sorry, if I was not clear.

I meant: If you click on any Country at the bottom table, like China, your formula comes back as 578,019.30 I was hoping to see the same number at the bottom table.

# YTD Wage Inflation New Hires - Harsh  - Country=

SUMX(

    ADDCOLUMNS(

        SUMMARIZE(

            HRIS_TD_COMP_WAGE_DETAIL_NEWOLD ,

            HRIS_TD_COMP_WAGE_DETAIL_NEWOLD[Country] ) ,

        "@Totals" ,

        [YTD Wage Inflation New Hires] ) ,

    [@Totals] )


I am wondering they should reconcile. sum of wage inflation of all the people (Executive, Manager etc.) should sum up to with Country as well.

Thanks,
EZ

Hello @rit372002,

So you’re suggesting that when you click onto a country i.e., for example, China. In the top table, you’re getting a value as $5,78,019 and then you’re expecting the same value to be reverted back again to the country table i.e., China should also show a value as $5,78,019. Is that what you’re suggesting?

Thanks and Warm Regards,
Harsh

@Harsh yes, that is correct. Thanks for looking into it.

Hello @rit372002,

Well, in that case, you’re just referencing the wrong measure inside the “Country” related one. Change the measure which is being referenced i.e., from “[YTD Wage Inflation New Hires]” to “[# YTD Wage Inflation New Hires - Manager - Harsh]” which we have created just above in this particular thread. Below is the measure alongwith the screenshot of the final results provided for the reference -

# YTD Wage Inflation New Hires - Country Harsh 2 =
SUMX(
    ADDCOLUMNS(
        SUMMARIZE(
            HRIS_TD_COMP_WAGE_DETAIL_NEWOLD ,
            HRIS_TD_COMP_WAGE_DETAIL_NEWOLD[Country] ) ,
        "@Totals" ,
        [# YTD Wage Inflation New Hires - Manager - Harsh] ) ,
    [@Totals] )

So now, in the above screenshot, you’ll observe that when you click onto any country, the figure which is shown in the first section of table is now also reflecting onto the second section of the table as well.

I’m also attaching the working of the PBIX file for the reference purposes.

Hoping you find this useful and meets your requirements that you’ve been looking for.

Thanks and Warm Regards,
Harsh

DNA - Harsh v2.pbix (8.4 MB)

@Harsh

Really appreciate it but I do see some more discrepancy. I see 3 issues:

  1. When I click on “Manager”, I see -3,633,507, I was assuming, I should get -3,633,507 there in the Country table as well, I am seeing -1,228,954 as overall sum, I was hoping to see -3,633,507

  1. As a test, I tried the earlier measure I you created for Manager Level , which does show overall number as -3,633,507 but if you sum the individual rows then it comes out to be -1,228,954 so the total is wrong here.

  1. I added another tab in the file: Silo
    When I click on Executive: I see -4,584,584
    Same number I see in the below table: -4,584,584

but when you sum individual rows at the bottom table, it comes out to be -5,778,876

Here is the updated file:

https://drive.google.com/file/d/1EPI2n3k4dOI5brA8eBJn4JtJs6sgYrfs/view?usp=sharing

Just a general question: Is there any way to create 1 measure which works for all?

Really appreciate your help.
EZ

Hello @rit372002,

Your understanding is incorrect here in all the 3 scenario’s.

First Scenario:-

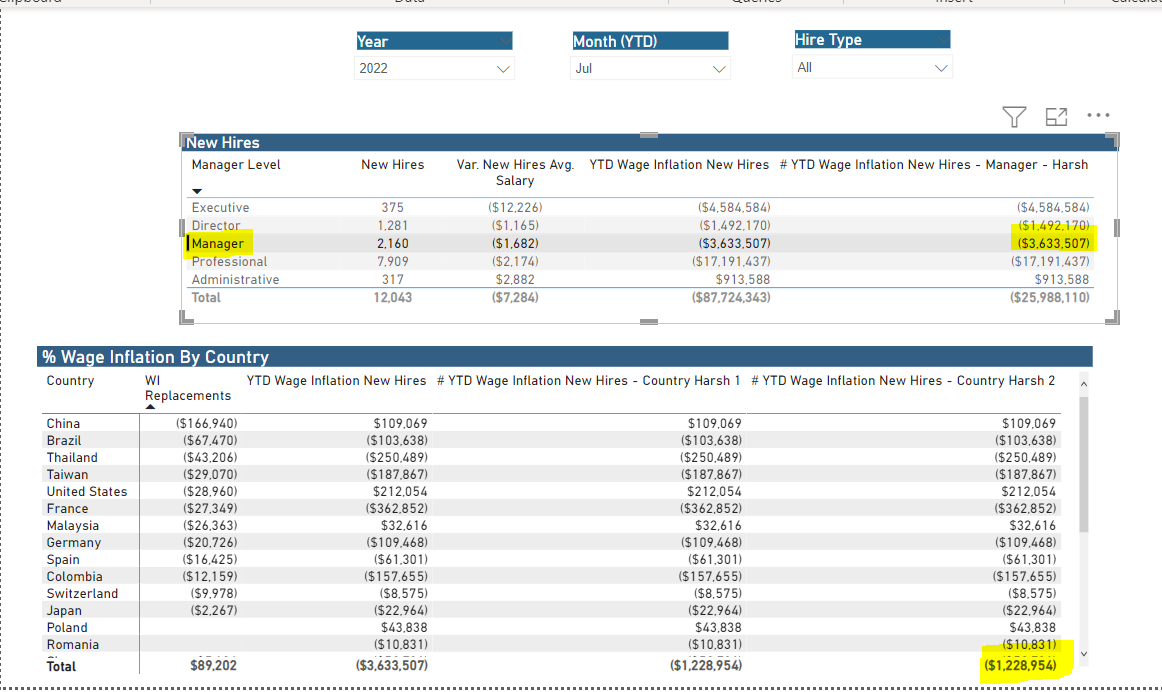
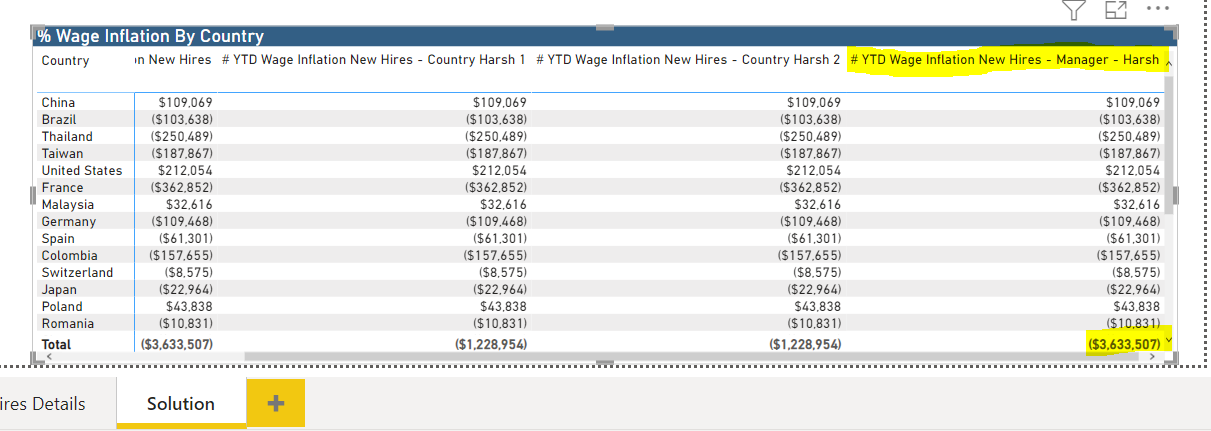
In this scenario, you’re clicking onto the “Manager” and filtering the results of second table. And then you’re expecting a result of $3,633,507 to be shown in the second table. Can I know why?

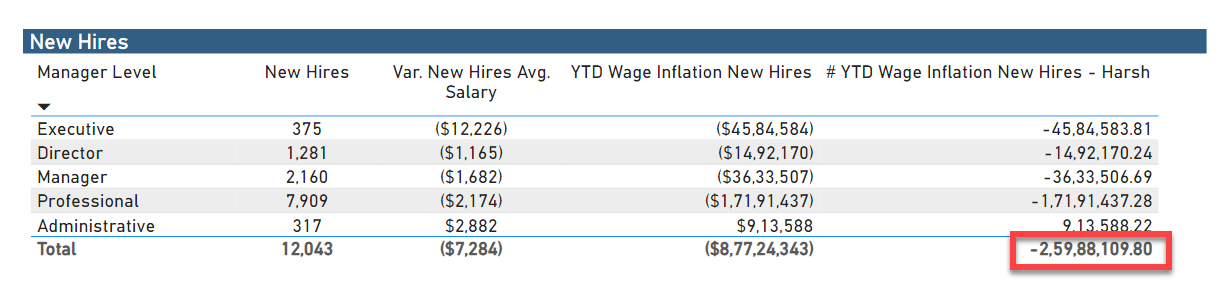
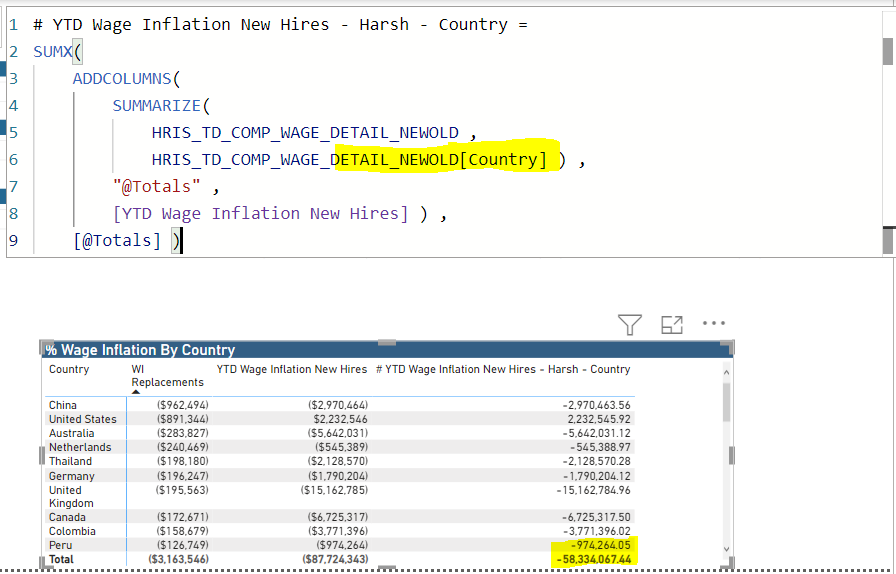
The Correct Grand Total in that case at a Country Level is $1,228,954. So when you’re expecting a total to be shown as $3,633,507 then in that case, you’re expecting wrong results. If you want to see that same result then measure “YTD Wage Inflation New Hires” is already showcasing that in the first picture, there’s no need to create new measures again.

Second Scenario:-

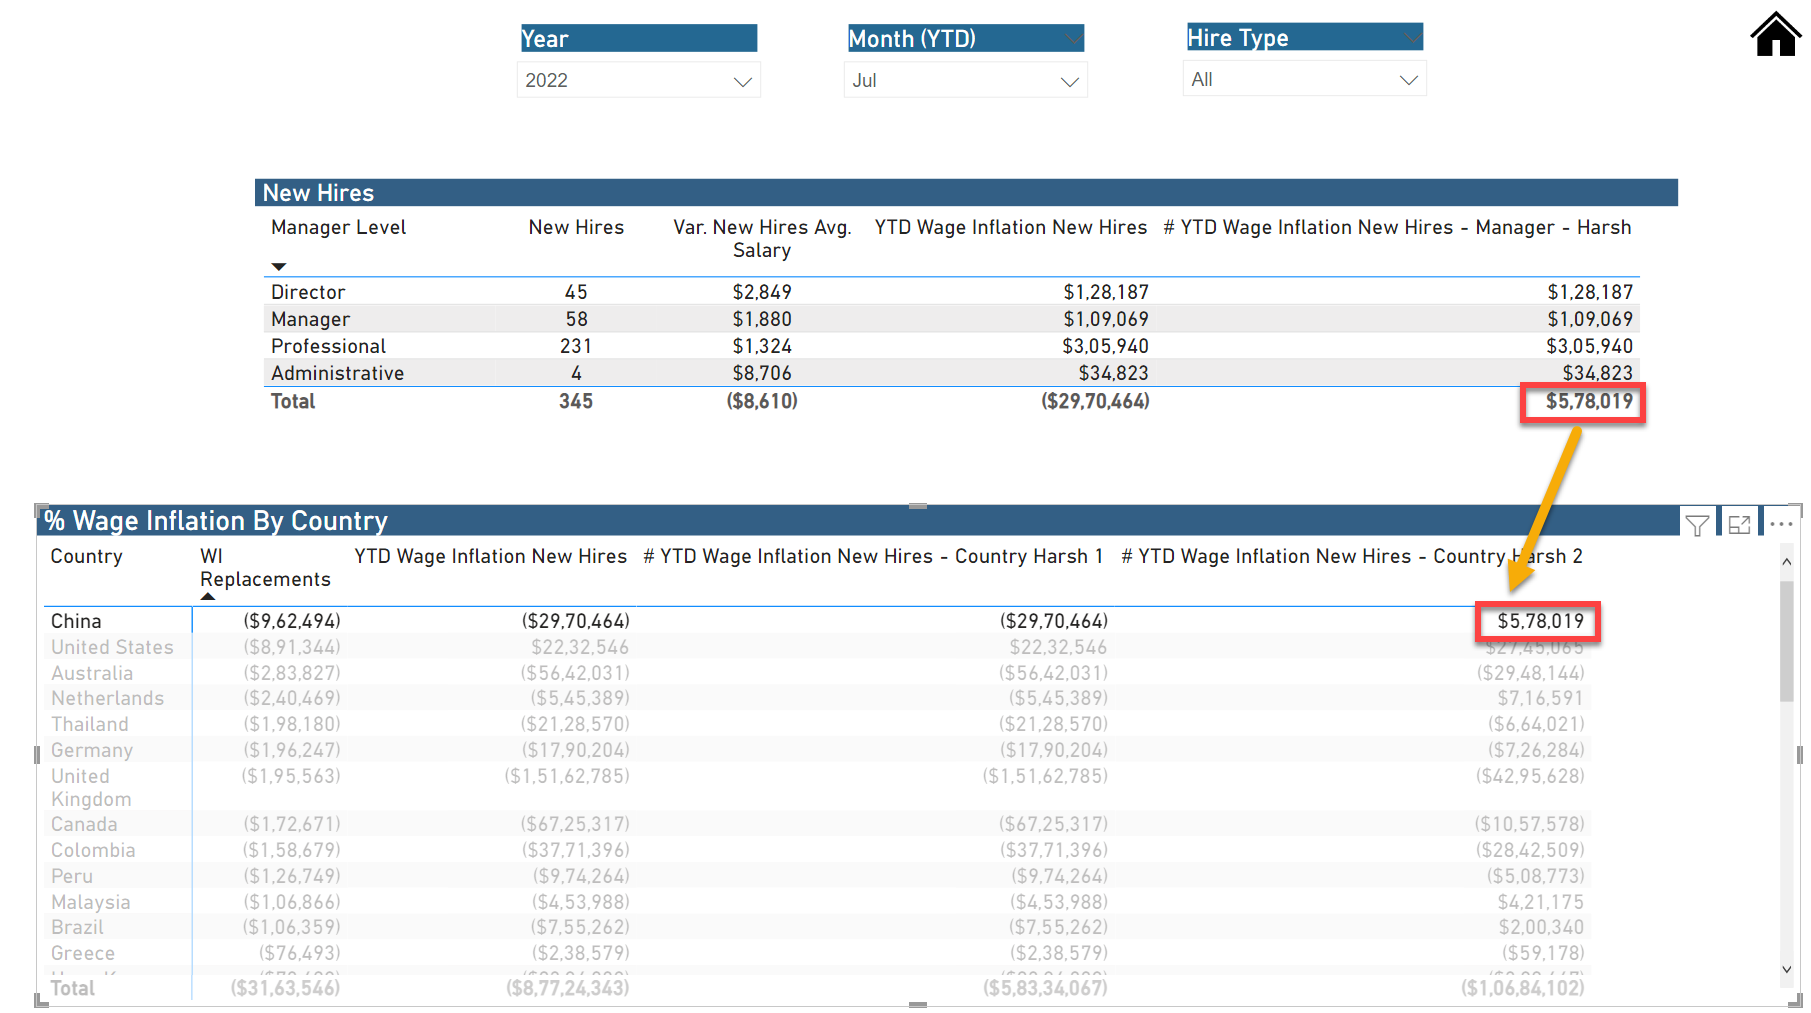
The reason why second test is giving you the same results in both the tables is because you’re using the one same measure in both of the tables which was created only for the first table.

The measure for the first table contains the context at a “Manager Level” whereas the measure for the second table contains the context at a “Country Level”. Since you wanted to see the correct totals for both the tables, measures were created accordingly based on that context.

Now, you’re suggesting that when you filter one table, the other table should show the same numbers as of the first table then in that case your expectations are incorrect.

Third Scenario:-

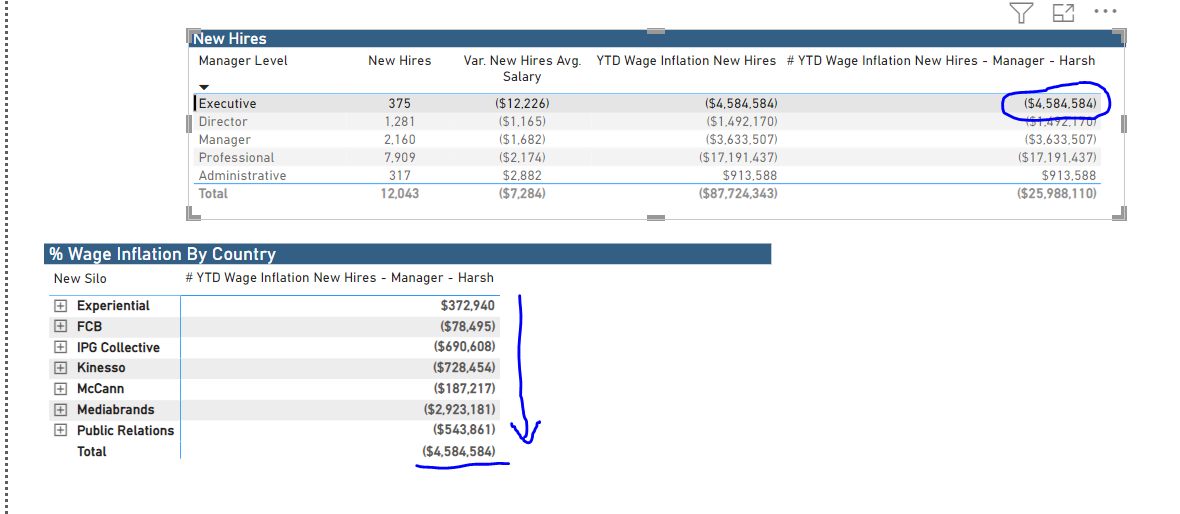
In the third scenario, you’re adding “New Silo” into the context but using the same measure which was created for “Manager Level” context and expecting the totals to be different. How is that possible? If you’re changing the context inside the table visual then your context inside the measure also needs to be ammended accordingly. If you want correct totals for Silo then incorporate the Silo as a context inside your measure.

Lastly, the answer to your question - “Is there any way to create 1 measure which works for all?

Have you ever seen Sam Mckay or any other Power BI expert creating one measure which suits in all the scenario’s. If that would have been possible than Power BI would have been much simpler tool and everybody would have been using it.

In case, you want to understand how the different types of context works, please go through the videos or courses which are already avaialble onto our education portal.

Thanks and Warm Regards,
Harsh

2 Likes

Hi @Harsh, thanks for your detailed explanation!

Hi @rit372002, did the response provided by Harsh help in solving your query? If not, how far did you get and what kind of help you need further? If yes, kindly mark as solution the answer that solved your query.

@Harsh Thanks! It makes sense. I think they (Microsoft) need to fix TOTALS. Rather than doing all this jugglery of creating SUMMARY tables, only to get correct totals is insane.

Anyways, really appreciate your detailed explanation.

Thanks,
EZ