The model is simplified, but I think it has everything needed to replicate the problem. There are two dimension tables (student name and subject) and two fact tables (report data and predicted grades). They have 1 to many relationships between them.
For each subject, a student gets report grades at several points throughout the year. They also have grade predictions for most subjects. My calculations are:
Average predicted grade
Average trajectory (report) grade
Value-add (trajectory minus predicted grade)-if a positive score, students are doing better than expected.
A student’s average grade for all their subjects for a selected report cycle
Difference between the report grade for a subject and the average for all subjects
Value add for all subjects-the average trajectory minus predicted grade for a student for a selected report cycle
Value add difference between selected subject and all subjects
Not all subjects have predicted grades. Not all students have all the subjects. Not all report cycles have trajectory grades for all subjects. The calculations mainly work on a row-by-row basis, but the totals are incorrect in pivot tables and the value-add for all subjects is incorrect.
Hi @corkemp - Can you help with the calculation that is giving Incorrect result and what is expected. Based on the DAX Formulas and Data available calculation seems correct.
The trajectory - prediction total in the matrix containing student and subject is incorrect (top right of page 1). In Excel, the average of the values is 0.33 for Student 1, whilst in the matrix it is 0.48 (this is with filters removed for the report cycle).
This incorrect value carries over to the trajectory-predicted measure (all subjects). It should be 0.33. Consequently, it also carries over to the value-add difference between subjects (trajectory-predicted grade MINUS trajectory-predicted (all subjects)).
Hi @Corkemp - This is how Power BI works and as per calculations and data available Output is correct.
You will get .33 as total if you take Average of [Trajectory-predicted] for individual Subjects. However, when evaluating at Student level i.e. Top Hierarchy it will take Average of all Subjects combined without taking into individual Subjects.
To get output as .33 at Student level, need to create formula like below.
Hi @corkemp, did the response provided by @ankit help in solving your query? If not, how far did you get and what kind of help you need further? If yes, kindly mark as solution the answer that solved your query.
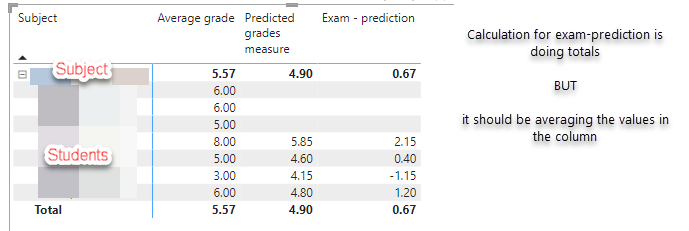
When I use your solution on my main dataset it isn’t working as expected. Please see the example in the image. The totals for the column that subtracts one value from another is doing it on the totals when I want it to average the values in the column so that blank values are not included.
This is the DAX I have used:
VAR AverageGrade = CALCULATE ( AVERAGE ( 'ExamData'[Grade (standardised)] ), 'ExamData'[Exam Category]="External Exam" )

VAR AveragePrediction = [Predicted grades measure]
RETURN

VAR GradePrediction =
IF(
    AverageGrade=BLANK()
        || AveragePrediction=BLANK(),
    BLANK(),
AverageGrade-AveragePrediction
   )
RETURN

IF(
    ISINSCOPE(SubjectInfo[Subject]),
    GradePrediction,
    AVERAGEX(SUMMARIZE(SubjectInfo,SubjectInfo[Subject],"TP_AVG",GradePrediction),[TP_AVG])
    )