Incorrect Cumulative Total - Need Help

Hello friends,

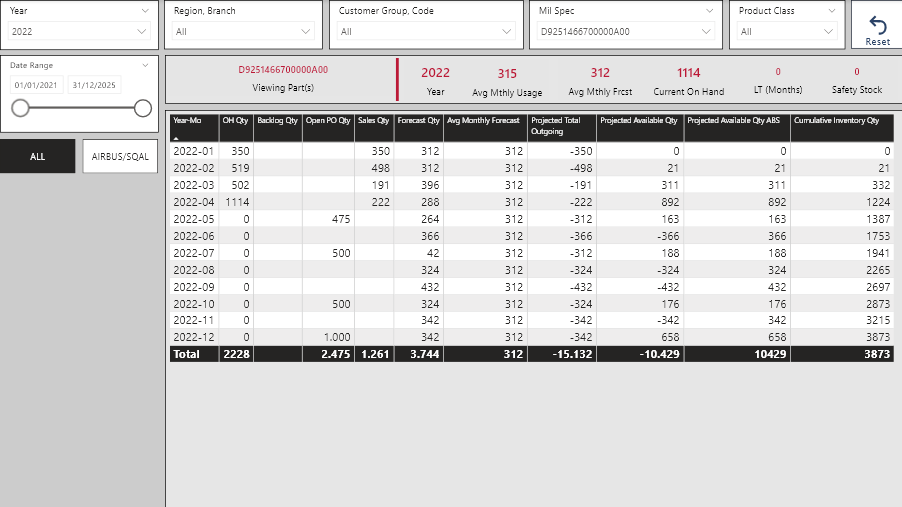
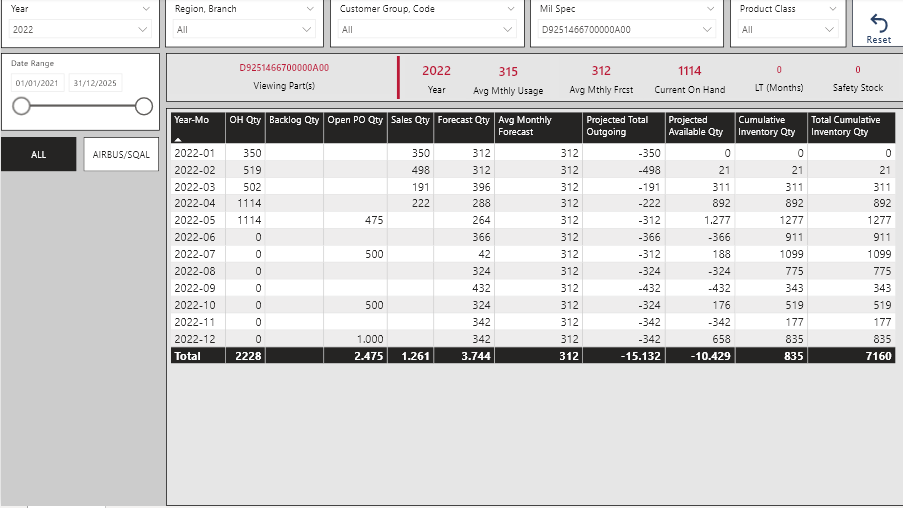
I have been going back and forth on this for a while now and I can’t seem to figure out what I’m doing wrong. I’m trying to create a cumulative total column from my Projected OH Qty. The Projected OH is a measure that takes Current OH + Incoming + Outgoing (which is shown as a negative). For example:

Current OH = 350
Incoming = 0
Outgoing = -350

350 + 0 + -350 = 0 >>> Projected OH Qty

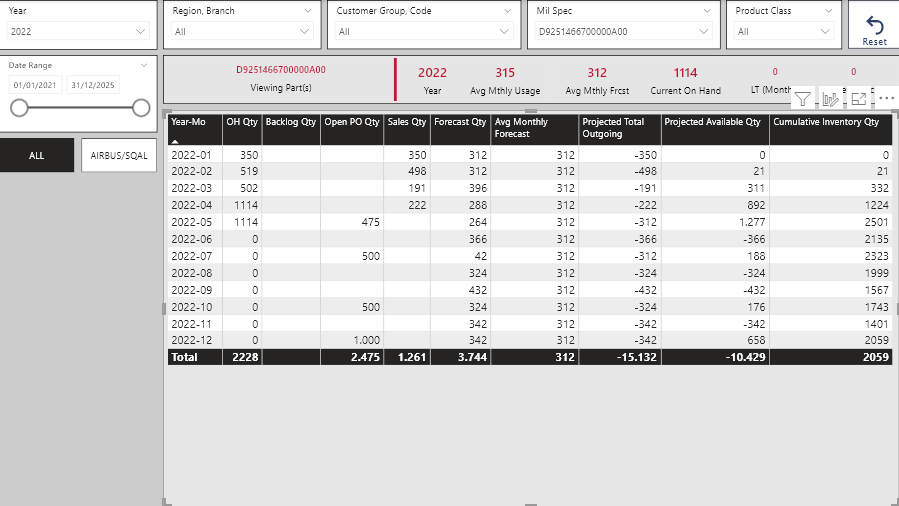
I have tried everything under the sun; I’ve watched so many videos, read many forum posts, including the “Calculate Days of Zero Stock” from your Inventory Management Insights. Although I don’t really need to count how many days stock was at zero, the cumulative measure looked like it would work. But it doesn’t.

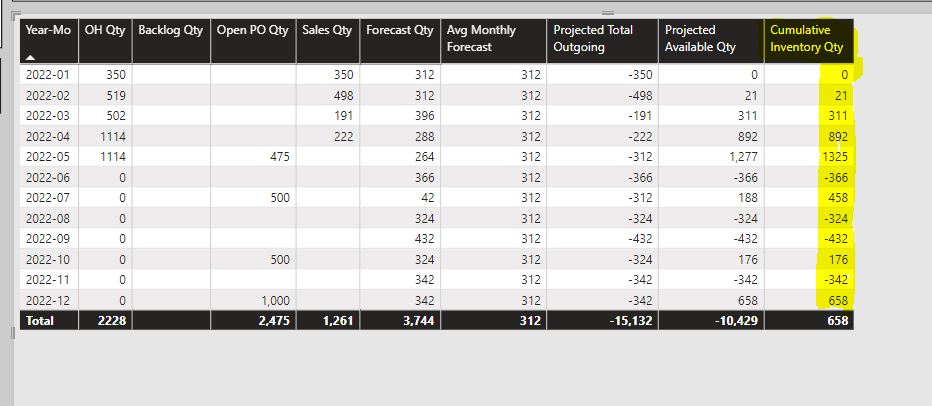
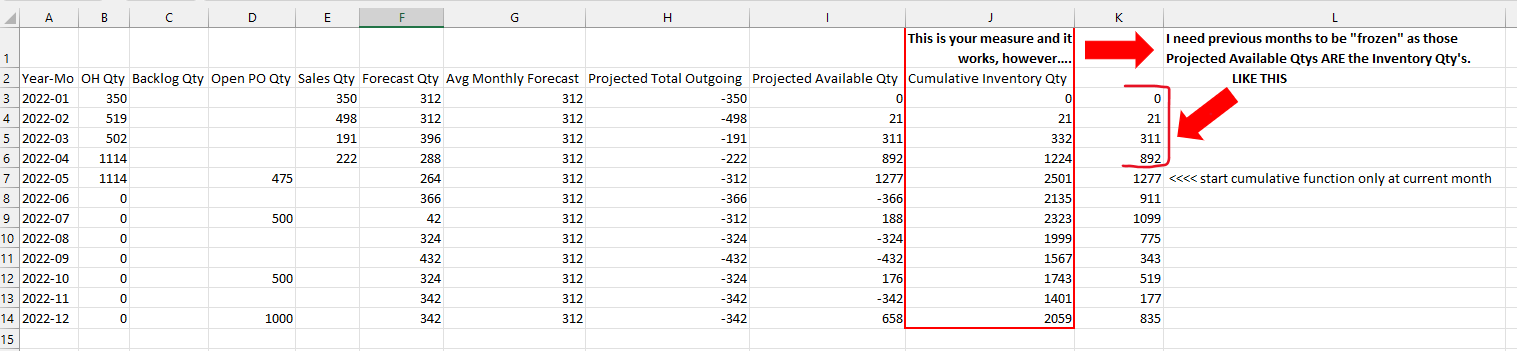
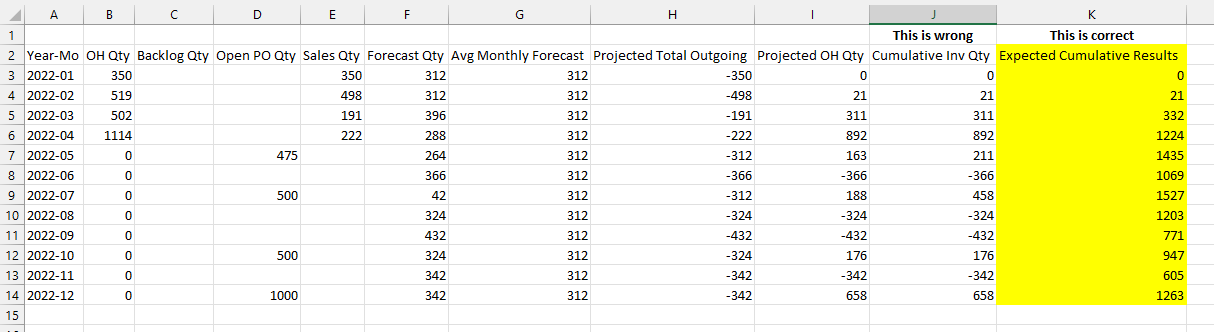
Logically, it’s almost like I need to figure out a way to store the Projected OH Qty as a absolute VALUE in a table that would just consist of Year-Mo and Projected OH Qty. If I could achieve that, I think that creating a cumulative total from that table would work. But I cannot figure out how to do that either. (head exploding)

Below is a sample of what I need:

I have attached a sample pbix. I’m hoping that someone can give me some insight into what I’m doing wrong. All the columns in the table are measures.

Customer Forecast Sample.pbix (15.6 MB)

1 Like

Hello @Rose,
Thank you very much for posting your query in the forum.
I have a doubt reading your comments about the expected result and seeing the image you have shared. Is the expected result the cumulative absolute value of the measure [Projected Available Qty ] ?

In the image, I believe that the expected result does not correspond to the definition.

Regards,

1 Like

Thanks for your help @jafernandezpuga!

Hope the solution provided above solves your query @Rose. Be sure to tag it as “solution” when it does.

Thanks!

1 Like

@jafernandezpuga,

Column K shown in the Excel illustration is what I am expecting the result to be. If you look at the sample PBIX you can see that the “Cumulative Inventory Qty” in Power BI is NOT correct. It’s just repeating the numbers from the “Projected Available Qty” (sort of…sometimes it does, sometimes it doesn’t). I just need the “Cumulative Inventory Qty” to cumulatively ADD the “Projected Available Qty” (if the number in the Projected Available Qty column is negative, then of course, the total would go down as shown in the Excel illustration. Ignore the “Projected Available Qty ABS” column in the above screen shot. The picture below shows how it appears in the sample PBIX file.

Sorry for the confusion.
Rose

That was not a solution. You asked a question. See my response below.

Hi @Rose,
Thank you very much for the clarification. Another difference that I observe between the pbix file and the excel file is that for 2022-05, the [Current OH Qty] measure has a value of 1114 while in the excel it appears with a value of 0.
To calculate the cumulative value of the [Projected Available Qty] measure, I created the following measure:

Cumulative Inventory Qty =
VAR _MinYearMonth =
CALCULATE(
    MIN( GDP_FSCAPF[YEAR-MO] ),
    ALLSELECTED( PBI_FSCAPF[YEAR-MO] )
)
VAR _MaxYearMonth = CALCULATE(
    MAX( GDP_FSCAPF[YEAR-MO] ),
    ALLSELECTED( PBI_FSCAPF[YEAR-MO] )
)
VAR _CurrentYearMonth = SELECTEDVALUE( PBI_FSCAPF[YEAR-MO] )

VAR _TableYearMonth = CALCULATETABLE(
    ADDCOLUMNS(
        VALUES( PBI_FSCAPF[YEAR-MO] ),
            "@Value", [Projected Available Qty]
    ),
    FILTER(
        ALLSELECTED( PBI_FSCAPF ),
        GDP_FSCAPF[YEAR-MO] >= _MinYearMonth &&
        GDP_FSCAPF[YEAR-MO] <= _MaxYearMonth
        
    )
)
VAR _FilterTableYearMonth = FILTER(
    _TableYearMonth,
    [YEAR-MO] >= _MinYearMonth &&
    [YEAR-MO] <= _CurrentYearMonth
)
VAR_Result =
IF(
    HASONEVALUE( PBI_FSCAPF[YEAR-MO] ),
    SUMX( _FilterTableYearMonth, [@Value] ),
    SUMX( _TableYearMonth, [@Value] )
)

 RETURN
 _Result

This is a screenshot of the result obtained.

I have used the following code to debug the values ​​that are filled in the virtual tables:

//RETURN CONCATENATEX( _TableYearMonth, PBI_FSCAPF[YEAR-MO] & " : " &ROUND( [@Value] , 0 ) , UNICHAR(10), PBI_FSCAPF[YEAR-MO] & " : " &ROUND( [@Value], 0 ), ASC)

// RETURN CONCATENATEX( _FilterTableYearMonth, [YEAR-MO] & " : " &ROUND( [@Value] , 0 ) , UNICHAR(10), [YEAR-MO] & " : " &ROUND( [@Value], 0 ), BSA)

To perform this debugging, I have relied on the following post by @BrianJ:

I hope you find it useful.

Regards,

Customer Forecast Sample_JAFP.pbix (15.6 MB)

@Jafernandezpuga,

This is SPECTACULAR and exactly what I was trying to achieve! THANK YOU.

However, I have one small wrinkle to add to this equation. The customer does not want the cumulative equation to start until the current month. The “Projected Available Qty” IS the ending Inventory for those months.

For example, we are in the 5th month (2022-05), so the previous months should NOT be included in the cumulative function. See below.

I tried to add something to your measure which set the MinMonth as the current month, but that threw off all my totals again.

Let me know if you need more info.

Thank you so much for this!

Hello @Rose,
I have modified the measure so that the accumulated is done from the current year and month.

Cumulative Inventory Qty = 
VAR _CurrentYearMonth =
YEAR( TODAY() ) & "-" & FORMAT( MONTH( TODAY() ), "0#" ) 
VAR _MinYearMonth = CALCULATE(
    MIN( PBI_FSCAPF[YEAR-MO] ),
    ALLSELECTED( PBI_FSCAPF[YEAR-MO] )
) 
VAR _MaxYearMonth = CALCULATE(
    MAX( PBI_FSCAPF[YEAR-MO] ),
    ALLSELECTED( PBI_FSCAPF[YEAR-MO] )
) 
VAR _SelectedYearMonth = SELECTEDVALUE( PBI_FSCAPF[YEAR-MO] ) 
VAR _TableYearMonth = CALCULATETABLE(
    ADDCOLUMNS(
        VALUES( PBI_FSCAPF[YEAR-MO] ),
            "@Value", [Projected Available Qty]
    ),
    FILTER(
        ALLSELECTED( PBI_FSCAPF ),
        PBI_FSCAPF[YEAR-MO] >= _MinYearMonth &&
        PBI_FSCAPF[YEAR-MO] <= _MaxYearMonth
    )
) 
VAR _FilterTableSelectedYearMonth = FILTER(
    _TableYearMonth,
    [YEAR-MO] = _SelectedYearMonth
) 
VAR _FilterTableYearMonth = FILTER(
    _TableYearMonth,
    [YEAR-MO] >= _CurrentYearMonth &&
    [YEAR-MO] <= _SelectedYearMonth
) 
VAR _FilterTableYearMonthTotal = FILTER(
    _TableYearMonth,
    [YEAR-MO] >= _CurrentYearMonth &&
    [YEAR-MO] <= _MaxYearMonth
) 
VAR _Result = IF(
    HASONEVALUE( PBI_FSCAPF[YEAR-MO] ),
    IF(
        _SelectedYearMonth < _CurrentYearMonth,
        SUMX( _FilterTableSelectedYearMonth, [@Value] ),
        SUMX( _FilterTableYearMonth, [@Value] )
    ),
    SUMX( _FilterTableYearMonthTotal, [@Value] )
) 

RETURN
_Result

The total of the column is being calculated as the accumulated value of the last month.
If you need the total to be calculated as the sum of the column, you can use this measure:

Total Cumulative Inventory Qty = 
VAR _MinYearMonth =
CALCULATE(
    MIN( PBI_FSCAPF[YEAR-MO] ),
    ALLSELECTED( PBI_FSCAPF[YEAR-MO] )
) 
VAR _MaxYearMonth = CALCULATE(
    MAX( PBI_FSCAPF[YEAR-MO] ),
    ALLSELECTED( PBI_FSCAPF[YEAR-MO] )
) 
VAR _TableYearMonth = CALCULATETABLE(
    ADDCOLUMNS(
        VALUES( PBI_FSCAPF[YEAR-MO] ),
            "@Value", [Cumulative Inventory Qty]
    ),
    FILTER(
        ALLSELECTED( PBI_FSCAPF ),
        PBI_FSCAPF[YEAR-MO] >= _MinYearMonth &&
        PBI_FSCAPF[YEAR-MO] <= _MaxYearMonth
    )
) 
VAR _Result = IF(
    HASONEVALUE( PBI_FSCAPF[YEAR-MO] ),
    [Cumulative Inventory Qty],
    SUMX( _TableYearMonth, [@Value] )
) 

RETURN
_Result

This is a screenshot of the result obtained.

I’m glad I was able to help you.
Regards.

Customer Forecast Sample_JAFP_V2.pbix (15.6 MB)

Thank you so much for helping me! This works perfectly and I think I understand what you did! Not only did you help me, you taught me a lot! I will definitely be using this again and again.

Thanks also for Brian Julius’ tips on CONCATENATE and CONCATENATEX.

A wealth of information! Thank you again!

Rose

1 Like