Income Statement vs Revenue Insights Tab in the Financial Reporting Application

Hi All

I have a question on the Financial reporting reports. My question relates to the
Income statement tab and the Revenue Insights Tab

I am not able to reconcile the following data in the Revenue Insights tab

  1. Table,
  2. Net Profits and
  3. Net Profit percentage

I have attached 3 pictures using 2017 as an example and a summary. eg

  • In 2017, Revenue was 56,566 in both the Income Statement & Revenue insights tab. The revenue tabs are all ok for both tabs

  • However the Net Profit & Net profit % (income statement table) and Net Profit + Net Profit% cards & Table in the Revenue Insights tab does not agree with the Income Statement table.

See photos below.

Income Statement:
IMG_8474

Revenue Insights:

IMG_8475

Summary: showing the difference between Net Profit & Net Profit %

IMG_8473

My question is how do I get the Numbers in the Revenue Insights to agree back to the Income statement? Many thanks

HI @atin

Could you please help us with the sample pbix file.

Hello @atin,

Thank You for posting your query onto the Forum.

  1. Well if you observe the insights carefully on both the pages i.e. Income Statement and Revenue Insights. Both of them show the insights at a different level of granularity that is Income Statement show the insights at a Yearly granular level and Revenue insights show the information at a Daily granular level. Which is but obvious, because you don’t consolidate and analyze the Income Statement Data at a Daily level.

  2. Another thing to observe here is, the Income Statement will include the incomes from Operational as well as Non-Operational activities. That is it will include β€œSales” figures as well as β€œRevenue” generated from other operations as well i.e. Sale of Subscriptions, Sale of Scraps, Sale Proceeds from Investments, Interest Received on Investments, Miscellaneous Incomes, etc. So in actual the formula looks like below -

All Operational Revenues - All Operational Expenses i.e. -

Gross Revenues - Gross Expenses = Gross Profits

Now, in Gross Profits you’ll add the Non-Operational Revenues and deduct Non-Operational Expenses i.e.

Gross Profits + Non-Operating Revenues - Administrative Expenses - Selling and Distribution related Expenses = Net Profit

  1. When you say β€œRevenue” it means that β€œRevenue/Income generated from Operating Activities” but when you say β€œIncome” it means that β€œMoney received/generated from all different sources”.

  2. The Income Statement page, considers all the β€œIncomes” and all the β€œExpenses” and then it calculates the β€œNet Profit” whilst the Revenue Insights page is showing and considering only β€œSales” and β€œCosts” figures and based on that it showing you as a β€œProfit” figures. So the β€œProfits” that you’re seeing right now, is only and only related to the β€œOperational Activities” and more importantly it’s showing/considering β€œCosts” per individual products and not all the Costs of Goods Sold figures. So the Profits figures that is being shown is also β€œProfits” pertaining to the Products and not a β€œGross Profit”.

  3. (Most Important In This Scenario) Last but absolutely not the least, the data that you’re trying to reconcile is the β€œDummy Data” so you won’t be able to reconcile it. This course and visualizations was just created from educational point of view to exclusively show that how one can show or portray this type of insights in Power BI. Once the concept is understood, you can take them to them next level and show them as per your requirements.

Hoping you find this points useful and helps you to understand why and how the figures shown on the Income Statement page is absolutely different from the Revenue Insights page.

Still if you need anything just give a shout and will be happy to help you. :slightly_smiling_face:

Thanks and Warm Regards,
Harsh

1 Like

Hi @MK3010

File attached - relates to the Financial application showcase created by Sam.

However my query relates to the Income Statement Tab & Revenue Insights Tab
Financial Reporting In Power BI - Income statement & Revenue Insights.pbix (903.9 KB)

Many thanks

Hello @atin and @MK3010,

Did you refer the post that I just posted? About how the data won’t be able to reconciled especially in this scenario.

Thanks and Warm Regards,
Harsh

Hi Harsh

Many thanks for your response

I read your comments though I am still struggling to understand why the numbers for both tabs are different given that we are working with the same dataset.

The dates is not the issue here because if it was, the revenues numbers would not tie back. The fact that we are using 2 different tables is possibly what is causing the discrepancy. ( ie the Company Expenses Table & Sales table. Moving forward, I am probably best having both tables as 1 single table.

I am in the process of using live data to create a Financial report and followed the same process in the examples which led to my initial question.

My background is in accountancy hence why I am very particular about data accuracy as I would be getting questions as to why the numbers are different. I will be disregarding the revenue insights page for now until I can figure a way to ensure that the numbers I am presenting agrees back to the I/S

Best wishes

Hello @atin,

If you want to understand why the numbers won’t match just go back to the Excel file to understand the reason Why?
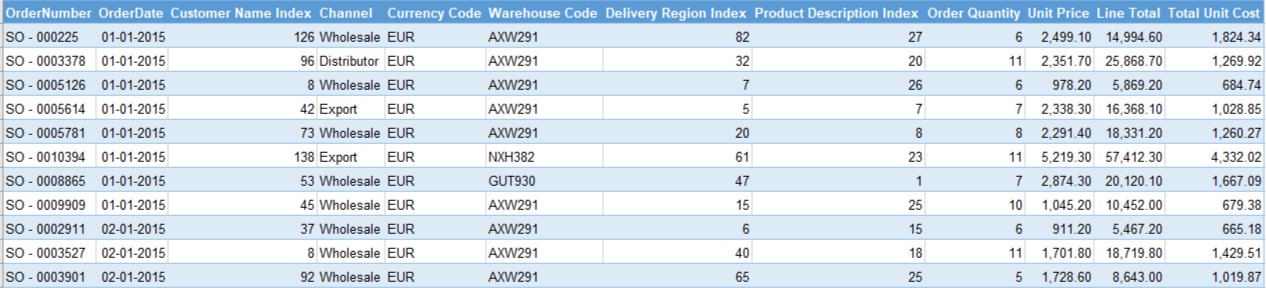
The β€œSales Data” contains the only Revenue figures i.e. Cost Per Unit of Product and β€œSale Per Unit of Product” whilst the β€œExpenses Data” contains β€œCost of Materials” as well as β€œOther Costs” as well. Below is the screenshot provided for the reference of both the data.

Sales Data Screenshot -

In the above screenshot it does not include any other costs apart from Cost Per Unit of Product.
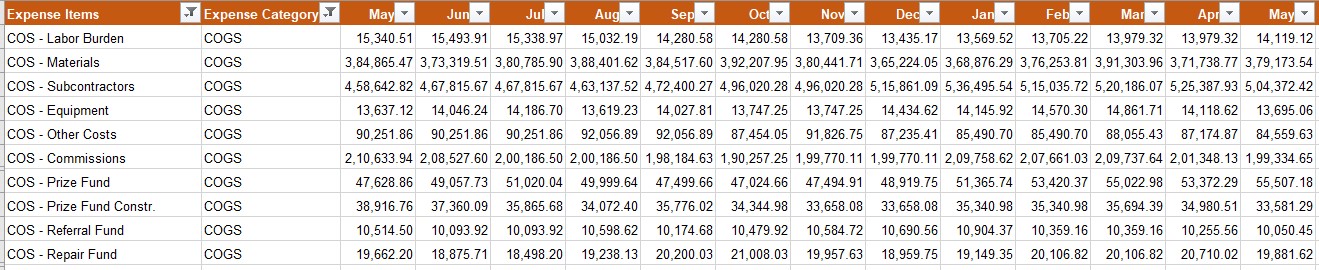
β€œExpenses Data Screenshot -”

Now, this screenshot includes all the Costs including β€œCost of Materials”. In actual, the Costs of Materials shown in the Expenses data should match with the Sales data but as I said in previous post, the data is randomized for each table. So your figures won’t be reconciled.

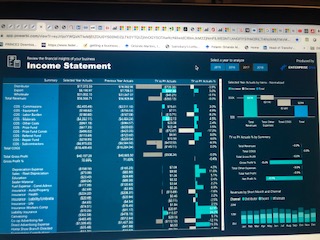
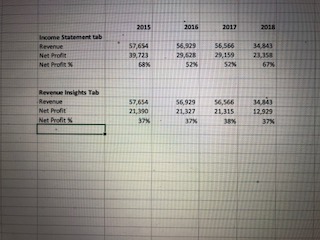
The revenue figures that’s why matched because under the Income Statement as well as Revenue Insights the data that’s being considered is same i.e. β€œSales Order Data” whilst for Expenses the Income Statement considers the β€œExpenses Table Only” which contains several other line items of expenses as well whereas the Revenue Insights consider the β€œSales Order Data” which contains only β€œCost per Product” so there’ll be bound to be a difference.

And as said earlier in the previous post and mentioned the formula, that Net Profit doesn’t only comprise of Sales - Expenses. It considers several other variables as well and that’s what has been shown under the Income Statement page. The Revenue Insights is more/kind off you can say a β€œProduct Insights” where it shows how Products have performed over a period of time and in cerain regions/territories. So how can the β€œNet Profit” figures match between these two or can be same?

Second thing is my background is also from the Accountancy and to be precise β€œChartered Accountant” so whenever I see this type of data before going forward with the analysis I perform my β€œAuditing Techniques” using β€œSampling Methods”.

In real life, your data is bound to match because at the end when we show our Balance Sheet analysis we can’t have difference between Assets and Liabilities figures. Because that is the ultimate thing that should match. In order to say that our β€œBooks Of Accounts” are arithmetically correct.

Most Important Note: And as being said earlier the course was designed just to create an awareness about how it can be done in Power BI and the main motive was not to tally the numbers.

I really hope that this points clears the air that you have about the Income Statement page and Revenue Insights page.

Thanks and Warm Regards,
Harsh

Hi @Harsh

Many thanks for providing further insights on the data.

Yes I do agree with your comments made. I wrongly assumed that the COS data in the Expenses table matched the **Costs data ** in the Sales Order Table.

As you rightly pointed out, the objective of the course was to create an awareness on how this can be done in PowerBI which for me has now been achieved.

Best wishes

Hello @atin,

You’re Welcome. :slightly_smiling_face:

I’m glad that I was able to help you.

Have a great and happy weekend. Cheers!!!

Thanks and Warm Regards,
Harsh

1 Like