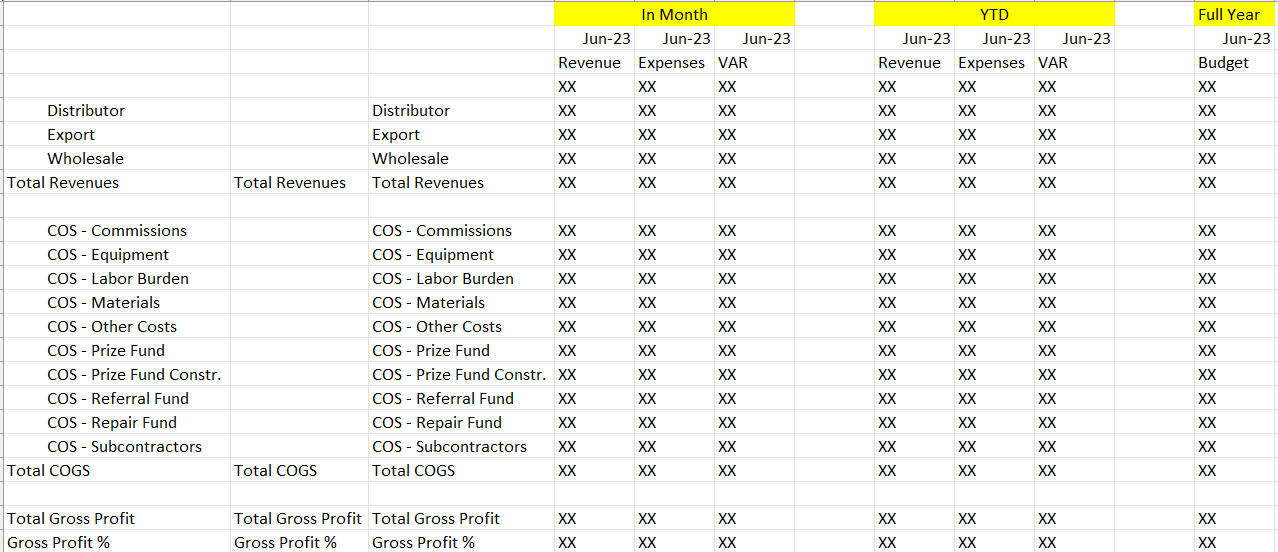
I am aiming to create the following table or matrix in Power BI and would greatly appreciate your assistance. Depending on the chosen Year and Month, I would like the column headers to dynamically display the month-year information and present the corresponding values.
Hi @AdamK - You can check the attached solution. In this
I have created a new table called FinalDates.
This is created using Append of 3 more tables in Power Query each for In Month, YTD, FullYear. Basically these individual tables will have dates for the range provided like for Jun 2014,
In Month will have dates for Jun 2014 only.
YTD will have from 1st Jan 14 till Jun 14 End.
FullYear will have from 1st Jan 14 to 31st Dec 14.
Also added a Category column to represent as per your visual requirement. Along with SortColumn to Sort the Categaory.
Created a Relationship b/w this table and existing Date table.
Used this table in Visual and as Slicer to get the required outcome (Refer Duplicate of Income Statement).
Do let me know in case of any query.
I think my only follow-up question is about the calculation for Subtotals (or Subcategories in your new table)? can we create a measure to calculate subcategories based on the custom (template) table?
Hi @AdamK - you shall be able to as new table has relationship with date table but will need changes. If not able to then can try by creating direct relationship between new tables and Fact tables.