HI @Harsh,
Ive been through the information you sent me and im struggling to understand a few things.
You Said
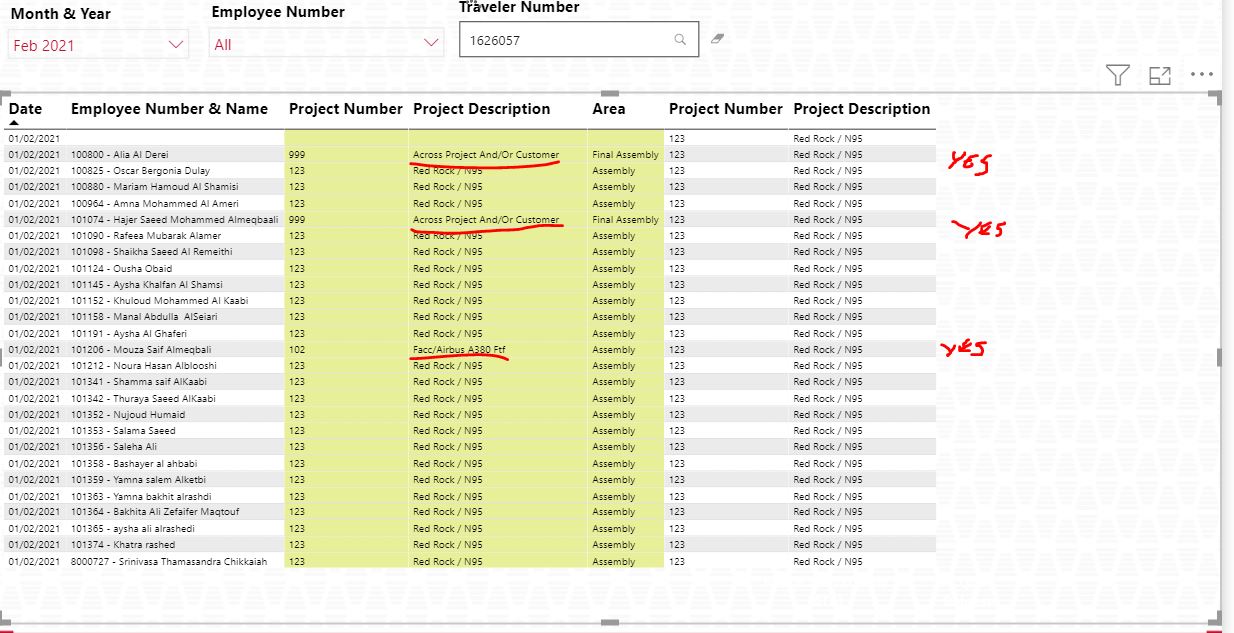
Now, how can you expect a result when you’re using all the different fields from the dimension table and putting them together in one visualization (table visual) where there’s no relationship between them in the first place.
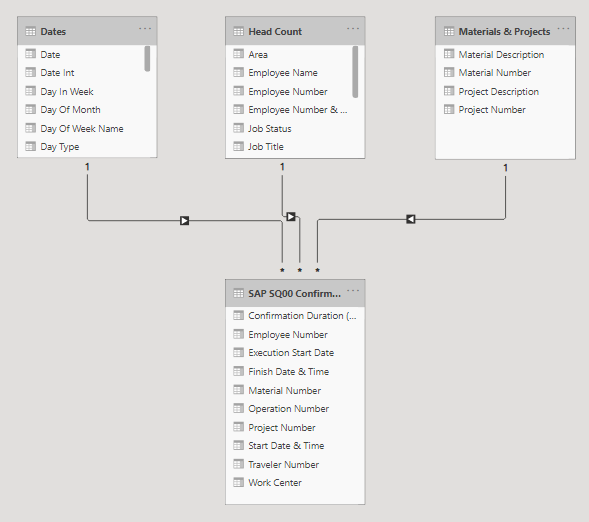
I do have relationships between them for head count its employee number and Materials its material number and Dates is start execution date.
Your dimnsion tables itself contains 10+ columns which is absolutely never recommended. Please go through the “ Advanced Data Transformations and Modelling Course ” and design your model properly. Below is the link of the course provided for the reference.
In the Radacad document they suggest dimension tables should be wide ?
## Dimension Tables are Wide
Another golden rule in designing dimension tables is to make them wide. Add fields that are related to that, more fields in the dimension table means more power for slicing and dicing the data. If you have just three fields of Customer first name, last name, and gender, then it means you can only slice and dice data by these three. However, if you have a customer table with all columns below, then you will have much more power in slicing and dicing;
As of now, your dimension table “ Head Count ” is containing the information like it contains in the fact table.
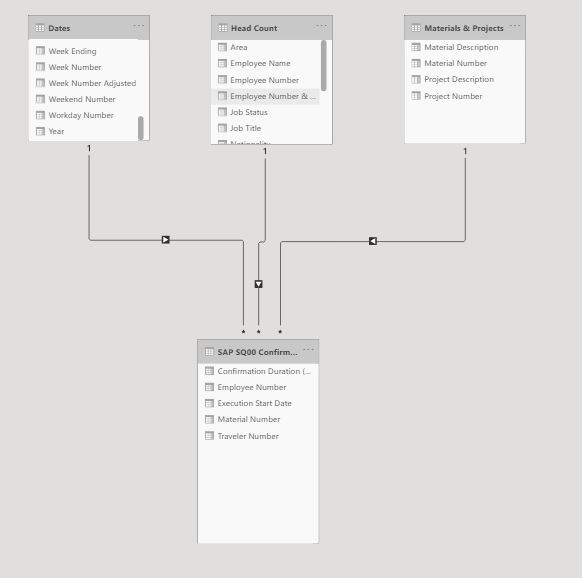
Ok fixed this issue and reduced the size of my fact table now it only contains the Key identifiers for the 3 dimension tables and 2 facts.
Employee number dimension link
Material Number dimension link
Date dimension link
Traveler is a fact although will never be aggregated and its not something youd add as a dimension table its like a sales order number.
And time is agregated fact and is the time each person spends on that transaction.
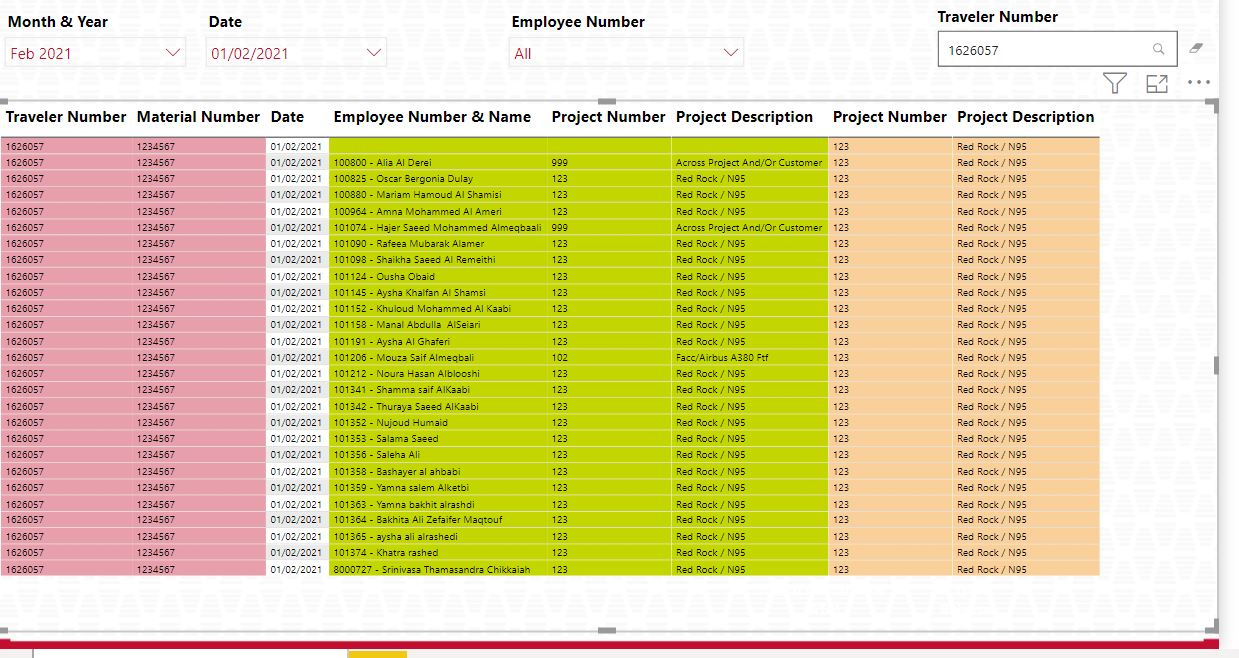
After making these adjustments i still get the same issue what is it im missing here?
is there any way you could adjust my PBIX to work so i can see what you have done?
New Relationships
EDNA SWitch or IF.pbix (953.5 KB)
Thanks Harsh sorry about this
Dan