Hello,
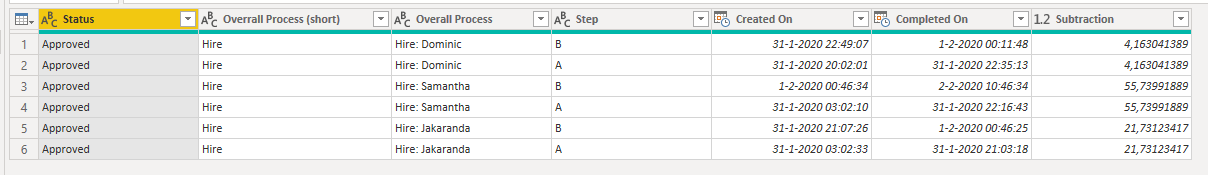
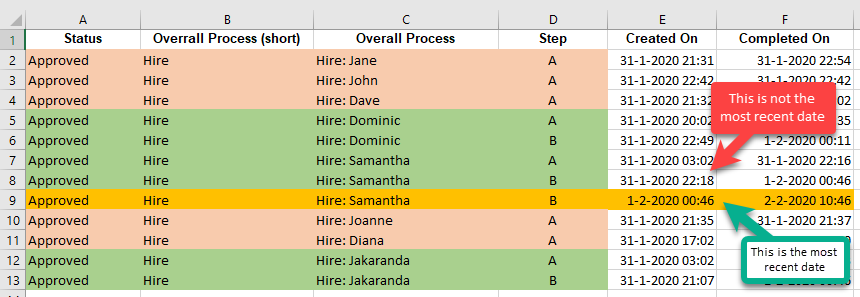
I am hoping to be able to automate this data metrics and calculations. I need to identify non duplicates - and remove them from the list or just ignore in the calculations. Also, in the cases where there are more than one Step (like step B in the example), the more recent date should be kept, the other one deleted. Then every Overall Process should have Step A and Step B. As in example - only the ones in Green should be kept for calculations.
In excel i would just do custom sort (1st level Overall process(asc), 2nd - Step (desc) and then use the formula for the average time to calculate = (B Complete time on - A Created on)*24.
If i anyone has done anything similar or would have any advice it would be most appreciated.
Thanks a million in advance. Example.xlsx (9.7 KB)
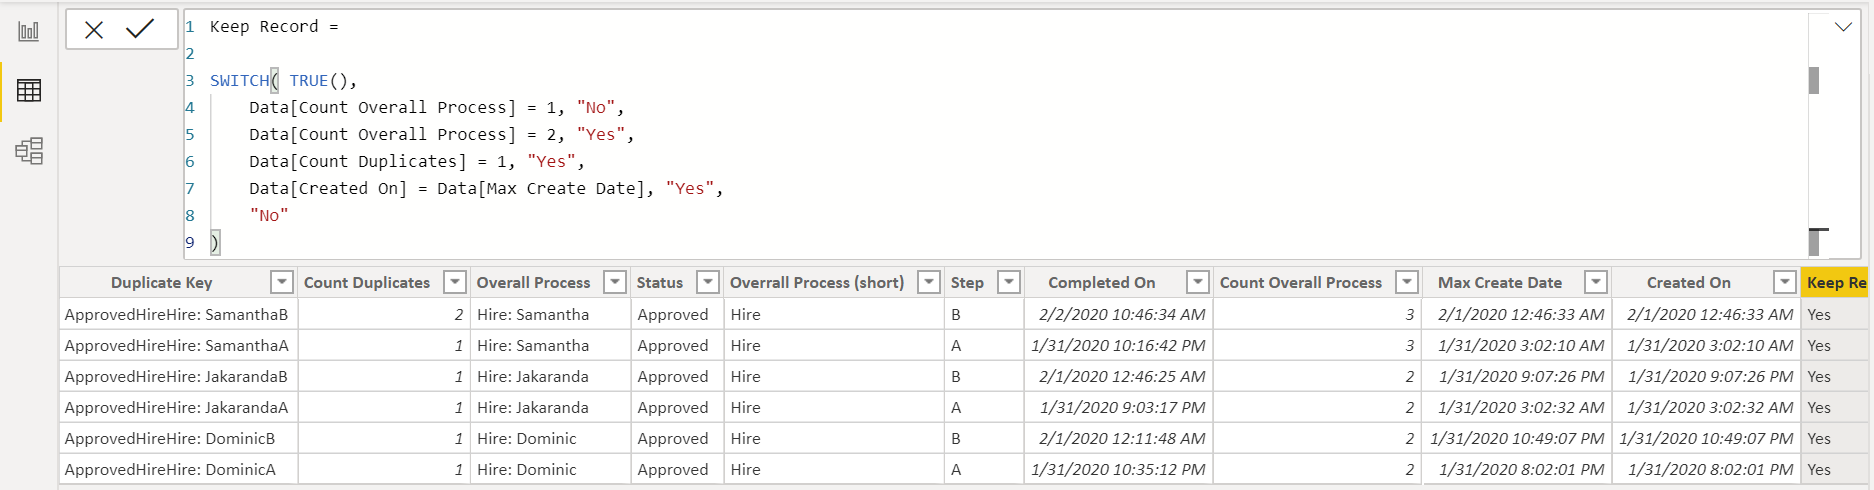
Then, in DAX created the following “Keep Record” calculated column, working logic off of the two grouping columns created above in Power Query, and then filtered the data table only to keep the records where “Keep Record” = “Yes”:
.
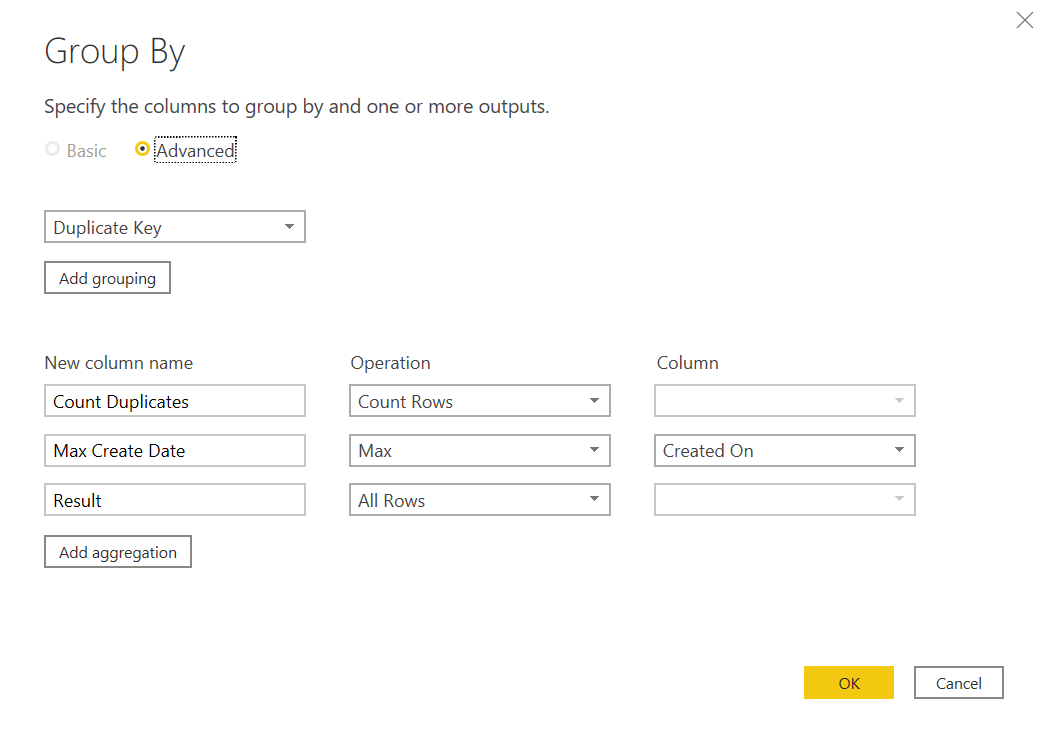
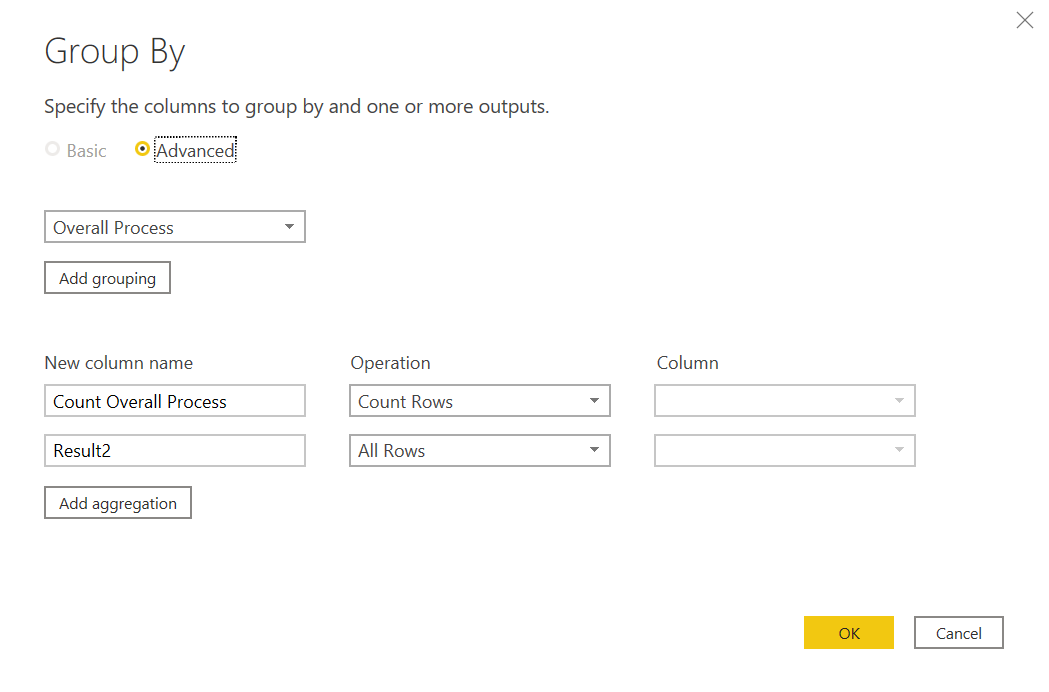
So first I Grouped the Rows by: “Status”, “Overrall Process (short)” and “Overall Process”
That allowed me to identify records that were only listed once and remove them. Next I sorted the data descending, extracted it again and finally Removed Duplicate ( “Status”, “Overrall Process (short)”, “Overall Process”, “Step”)
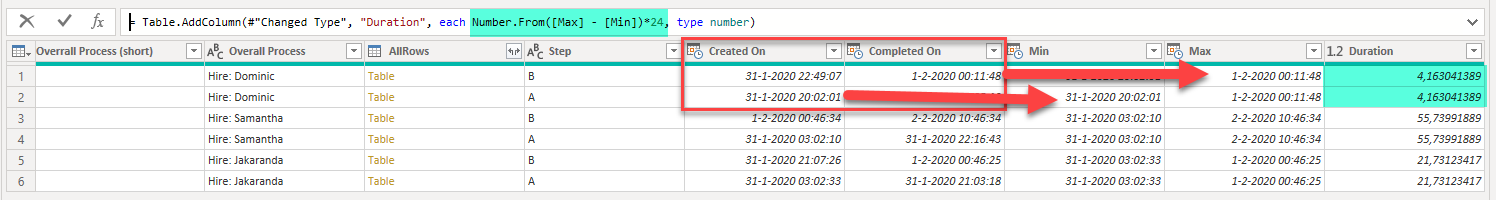
Melissa, you are right, i highlighted the wrong row!! I will have a look at the solution, amazing to see that it is actually possible (probably). How could i then minus the completed on minus created on to get the time taken for the Process? And then Calculate the average as a whole?
Hey Brian! Brilliant, thanks for looking at this. I was also asking Melissa:
How could i then minus the completed on minus created on to get the time taken for the Process? And then Calculate the average as a whole? Do you have any ideas?
How could i then minus the completed on minus created on to get the time taken for the Process? And then Calculate the average as a whole? Do you have any ideas?
I do, but I made the tragic mistake of running upstairs for a snack and a drink. With a 10 minute head start, @Melissa’s solution should be arriving any moment now…
Looks exactly what i need Melissa! you helped me out again. Can i just ask one last thing please: how did you identify min/max per Overall Process per person? did you use Calculate and Earlier functions?
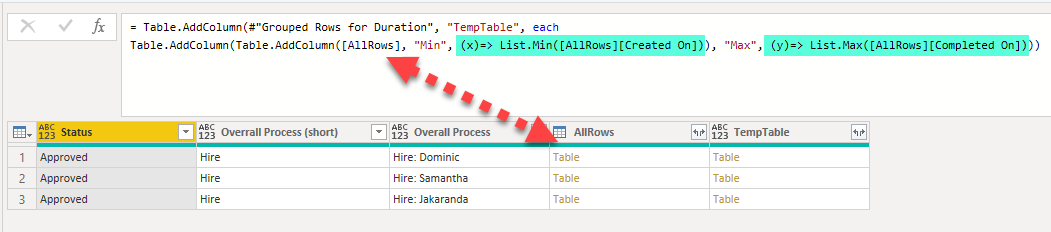
No nested table funcions inside Power Query… So I wrote a bit of M code, here’s what I did:
Made another Group By table containing AllRows then transformed that nested table by adding 2 columns one for the Min Created On date of that set and one for the Max Completed on date of that set.
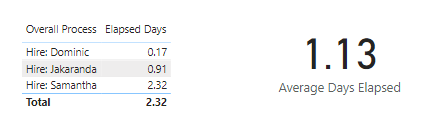
Glad to help – that was fun. FYI – I revised the Elapsed Days measure and the solution file posted. Still returns the same results, but is more robust if you end up putting more information into the table visual.
Just give a shout if you have any questions when you try these out with your data.
Hi both,
all is working out perfectly up until the calculating the A and B step per Person duration to complete. Think i missing something, so sorry to be bothering again. Did you do the new Group By by Step, Overall Process and in Operation you did Max completed on and Min Created on for AllRows? Think im really close just missing something.
Okay that’s sounds like the part with the nested table functions I illustrated yesterday. Please see if you can fix it by examining the M code for the each of the Applied Steps in the provided PBIX.
If you can’t resolve it, post another sample that matches your column headers and structure exactly. Then I’ll set it up for you.
Melissa, that worked out for me! Could i possibly identify if there are weekend in between the Closed on and Created in between Steps? So the Duration would only cover week days and no weekends?
In excel i was just doing the Networkdays function. In this case would you use Calendar function between the MIN and MAX dates that are used in the duration calculation?
 I will have a look at the solution, amazing to see that it is actually possible (probably). How could i then minus the completed on minus created on to get the time taken for the Process? And then Calculate the average as a whole?