Hello community,
I got the below sample data. My original database has ~30 columns, but I included only 2 (since I`ll need to be able to slice my result by them).
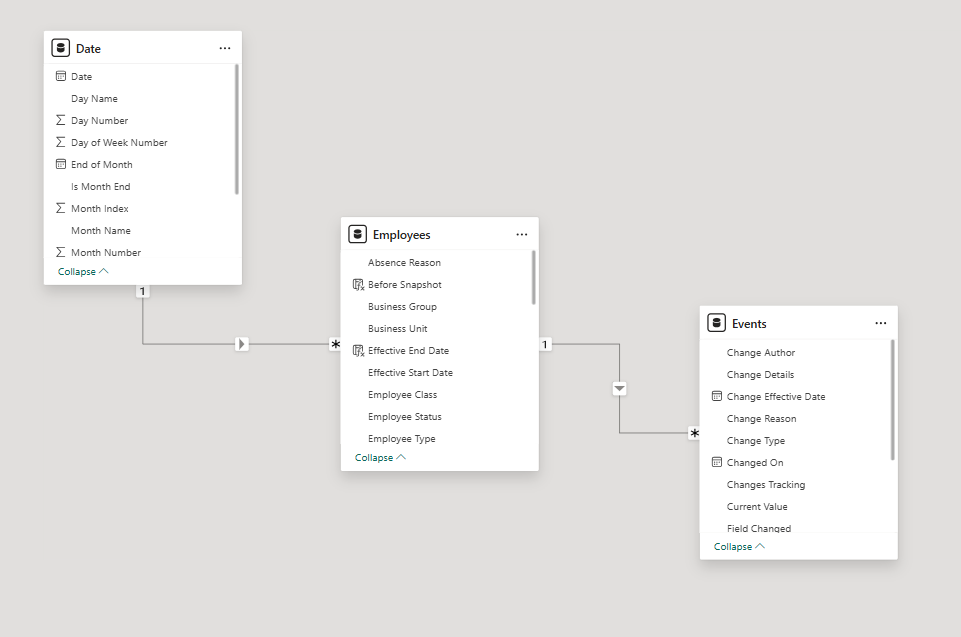
I also got a Date dimension table with a (1-many) relationship from Date[Date] to Employees[Effective Start Date] and an Event table with (many-1) relationship from Events[Key - Employee ID & Effective Start Date to Employees[Key - Employee ID & Effective Start Date]
The Employees table will never have same day records, but it can have multiple records in the same month.
| Effective Start Date | Employee ID | Employee Status | Labour Type |
|---|---|---|---|
| 12/31/2023 | 51115216 | Active | Indirect Labor |
| 1/31/2024 | 51115216 | Active | Indirect Labor |
| 4/30/2024 | 51115216 | Active | Indirect Labor |
| 3/31/2025 | 51115216 | Paid Leave | Indirect Labor |
| 4/30/2025 | 51115216 | Terminated | Indirect Labor |
| 12/31/2023 | 92999434 | Active | Indirect Labor |
| 12/31/2023 | 92999434 | Unpaid Leave | Indirect Labor |
| 1/31/2024 | 92999434 | Unpaid Leave | Indirect Labor |
| 6/30/2025 | 92999434 | Terminated | Indirect Labor |
| 3/31/2025 | 94062306 | Active | Indirect Labor |
| 5/31/2025 | 94062306 | Active | Indirect Labor |
| 8/31/2025 | 94062306 | Terminated | Indirect Labor |
| 7/31/2025 | 97001779 | Active | Direct Labor |
| 7/31/2025 | 97001779 | Active | Indirect Labor |
Okay, so I will have a date slicer from Date table (Year, Month and Date in a slicer). Users will be able to select more than one value in this slicer.
So I got two measures:
Snapshot Date = MAX('Date'[Date])
Baseline Date = MIN('Date'[Date])
This is an Employees database, so I`ll need to calculate the Headcount, Termination and Hires at the selected point in time.
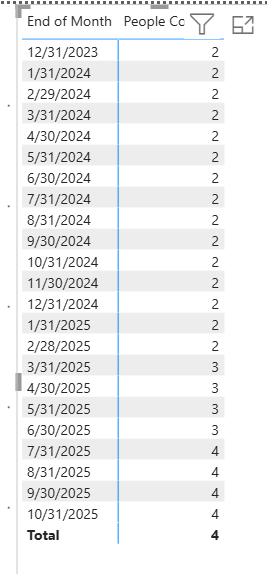
So I start off with an overall People Count:
People Count 2 =
CALCULATE (
    DISTINCTCOUNT ( Employees[Employee ID] ),
    FILTER (
        ALL ( 'Date' ),
        'Date'[Date] <= MAX ( 'Date'[Date] ) && 'Date'[Date] <> BLANK ()
    )
)
The reason why I do it like this is because some Employee IDs will not have values for some months. But if a user selects a date, regardless data exists or not, I need to view the People Count for it.
Okay, all looks nice until here, but the real fun only now begins.
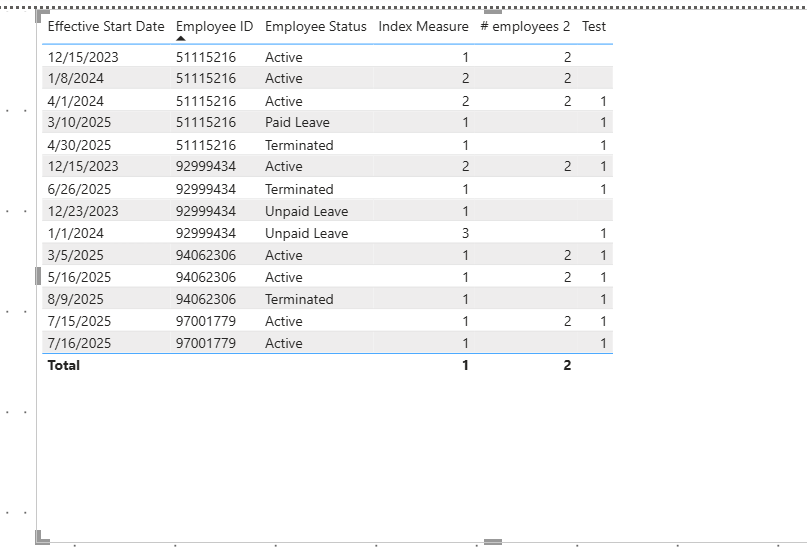
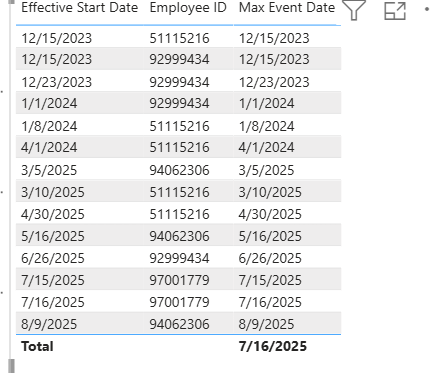
While my People Count retrieves a count of employees for each month, it is not correct. I figured I needed to count the distinct employee IDs from the latest records that are before the Snapshot Date (which is selected in a slicer by users). Below I have a screenshot, where for demonstration purposes I included Effective Start Date, Employee ID, as well as two columns,
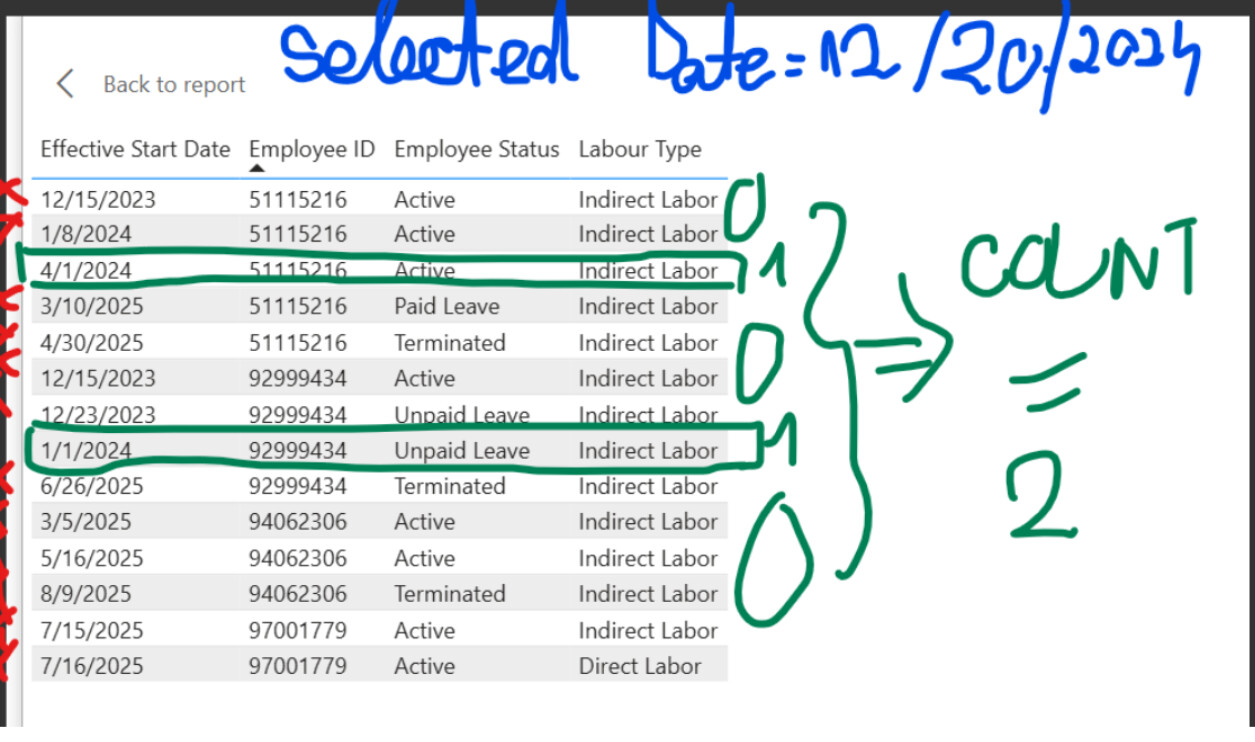
So looking at this screenshot, assuming that an User selected Date = 12/20/2024 in the Date slicer, the only rows counted are for employee 51115216 as of 4/1/2024 and employee 92999434 as of 1/1/2024. As per the screenshot, they`ll show as 1 each and 2 in total.
If let`s say I add a bar chart and I put on the X-axis the Employee Status, the slicer date selection remains 12/20/2024, I should see 1 active, 1 unpaid leave.
If I add the Labor Type on X-axis, I see 2 Indirect Labor.
If I add any other dimension, it will count accordingly.
I`ve tried multiple things out: I calculated a Max Event Date as explained here, but I figured that if I select a Date in the slicer for which my Employees do not have Effective Start Dates for, it will return Blank.
I ended up with this long formula:
Test =
var SelectedDate = MAX( 'Date'[Date] )
var CurrentEmployee = MAX(Employees[Employee ID] )
var MaxEffectiveDate = MAXX(
    FILTER(Employees, Employees[Employee ID] = CurrentEmployee && Employees[Effective Start Date] <= SelectedDate),
    Employees[Effective Start Date]
)
VAR MaxAll =
    MAXX (
        SUMMARIZE (
            VALUES ( Employees[Employee ID] ),               -- keeps your slicers
            Employees[Employee ID],
            "LatestDate",
                CALCULATE (
                    MAX ( Employees[Effective Start Date] ),
                    FILTER (
                        ALL ( Employees[Effective Start Date] ),
                        Employees[Effective Start Date] <= SelectedDate
                    )
                )
        ),
        [LatestDate]
    )

RETURN
CALCULATE( DISTINCTCOUNT( Employees[Employee ID] ), FILTER(Employees, MaxAll = MaxEffectiveDate ) )
But to no avail… I even tried ranking, no success. Please can someone help me? I`ve been struggling for days with this.