Hello everyone,
I’m dealing with carrying out power bi for the HR department and feel frustrated cause I’m kinda intermediate level.
Problem: the Excel file contains information about all employees in one year. The director wants to sort attributes based on the total of employees, salary, salary cap, sex, title, and the number of day-offs per MONTH, YEAR, and DEPARTMENT. The problem is data only contains the date of joining the company and the date of quitting. I actually don’t know how to sort this information down to MONTH. I tried to create other sheets for each department, then in which month If there are any new members joining or quitting, I did the accumulative math by using some basic Excel functions or creating several columns for increasing or decreasing then just letting the number at the beginning of each month + or - those increased or decreased numbers. This process is laborious and not substantial.
Question: If there are any faster and more convenient ways to deal with situations, I’d love to hear from you guys, any links or lessons that I could look up to would be a very worthy asset.
I sincerely appreciate that, everyone!
Ok, there’s a bit to unpack here so bear ![]() with me.
with me.
Some key columns you need in your data;
- A unique identifier for each individual employee, so employee ID is vital
- I’d say you don’t need to create separate pages for individual department as you want a Department field in your data.
- You MUST have a Date Table in your report, this is vital for Time Intelligence. Don’t forget to mark it as a Date Table once created.
- An employee start date and end (quit) date are required, sounds like you might have these
- With regards to days off per month, can you get this data with the employee ID and the dates they were off?
- Clarify the purpose of this report/data, it will make it easier to build the report. Is this report for tracking headcount, is it for tracking absence, is it for salary analysis etc. Get a really defined report/project spec, this will help you massively and may inform you better with how you need to create your data model.
- Creating a solid data model, with a date table, utilising Power Query to clean your day would allow you to build a quick solution.
- I don’t think you’d need to create a different page for new members joining or quitting, you could handle this in a main table that has a column for Start Date and End (Quit) Date.
- It is a bit difficult to give you more advice without seeing the source data and your PBIX file. You may not be able to share this but you could supply dummy/masked data.
You’re facing a common time intelligence issue in Power BI. To tackle this problem effectively, you’ll need to work with a date dimension and utilize it for aggregating data based on months and answering questions like how many employees were hired each month in a period, how many left the organization each month compared the previous month or the same month in the previous year.
You might find this to be a helpful place to start.
- got it
- Here the code "Dates =
VAR MinYear = YEAR ( MIN (‘Data’[Joiningdate]) )
VAR MaxYear = YEAR ( MAX (‘Data’[Quittingdate]) )
RETURN
ADDCOLUMNS(
FILTER(
CALENDARAUTO( ),
AND (YEAR([Date]) >= MinYear, YEAR ([Date]) <= MaxYear)
),
“Year”, FORMAT([Date], “yyyy”),
–“Calendar Year’, “CY” & Year([Date]),
“Month Name”, FORMAT([Date], “mmm”),
“Month Number”, MONTH ([Date]),
“Weekday”, FORMAT([Date], “dddd”),
“Weekday Number”, WEEKDAY([Date]),
“Year Month”, FORMAT([Date], “mmm yy”),
“Quarter”, “Q” & TRUNC((MONTH([Date] ) - 1) / 3) + 1
)” - Actually, I have one more column for “the day of changing department” (there are 5 people joining a new department (already existed), the old one is dimished → I actually dont know how to exclude this one, too). This column being recorded according to month.
- I have another sheet for days off per month , I get two columns for this sheet, 1 for the department name and the total of days off of each department in each month in 2023.
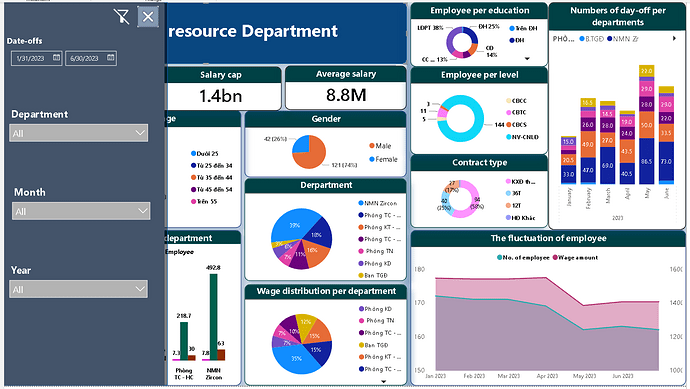
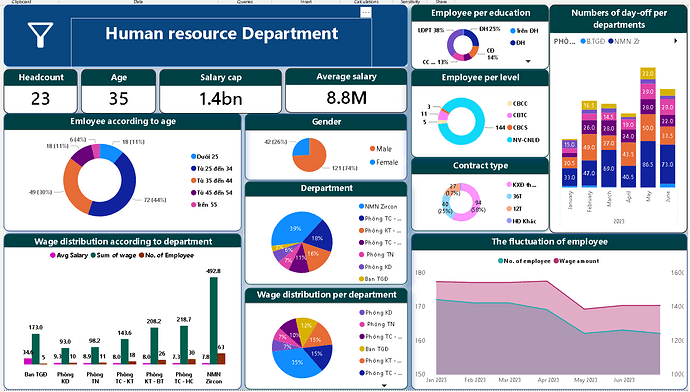
- This report would be one single dashboard page only, I’ll attach the image. Yes, It includes headcount, absence, salary, title, age, gender.
- Agree, here the code for headcount
"Headcount =
CALCULATE(COUNTX(FILTER(‘Data’,‘Data’[JoiningDate]<=Max(‘Dates’[Date]) &&(ISBLANK(‘Data’[JoiningDate]) || ‘Data’[QuittingDate]>MAX(Dates[Date]))),‘Data’[EmployeeID]))
" I once added “IF(‘Data’[SwitchingdepartmentDate]>‘Data’[JoiningDate],‘Data’[SwitchingdepartmentDate],‘Data’[JoiningData])” but it doesnt seem right. The way I resonated is If the switching date is probably the latest date, so I will prioritize that date. - I attach it down below, sr because the original file is in Vietnamese so I have to translate a little bit for your understanding.
Appreciate these feedbacks so much, guys. Happy powerbiing!
HRData.xlsx (955.8 KB)
Thank you so much, guys. I’ve been studying basics for just around one month so this means so much.
Appreciate your comment. I’m diving into it more. You could check my new reply above I listed specifically why I got stuck. Appreciate it a lot.
That’s quite a list of asks, it is also made more difficult by a PBIX file not being supplied, this would be crucial to getting you to a solution.
It might just be me, but I think you may need to break this down into more manageable chunks and provide a PBIX file for a forum member to help you.
Hi DavieJoe,
Here is the pbix file. Thanks for your guidance. I’ll point out my problem more clearly.
- I do want to count headcount sorting out by (year,month,department). But there are some who have been moved to other department at a certain dates (listed in a separate column “Date of changing department”), so changes might apply to some catergories such as headcount, salary cap, gender, position.
HRDepartment.pbix (278.9 KB)
Thank you in advance, I’d love to hear you guys opinions.
Happy powerbiing!

