Thanks for your submission Luke and great to know that you are developing your skill set well with Power BI.
I definitely think that this report has most of the information that you would need to understand the data well.
The only thing I think I would improve here is the look and feel of the report. Some of the visuals I think could be represented in a slightly more creative way.
But I’m definitely confident this will come in time when you have the opportunity to utilize all of the great resources that we have available with enterprise DNA.
Also don’t forget to use the color theme generator to generate a consistent theme across all of your reports in visuals.
Enjoyed the modelling part of the project and adhering to best practice as much as possible here.
I didn’t use many measures at all just some simple counts and filters.
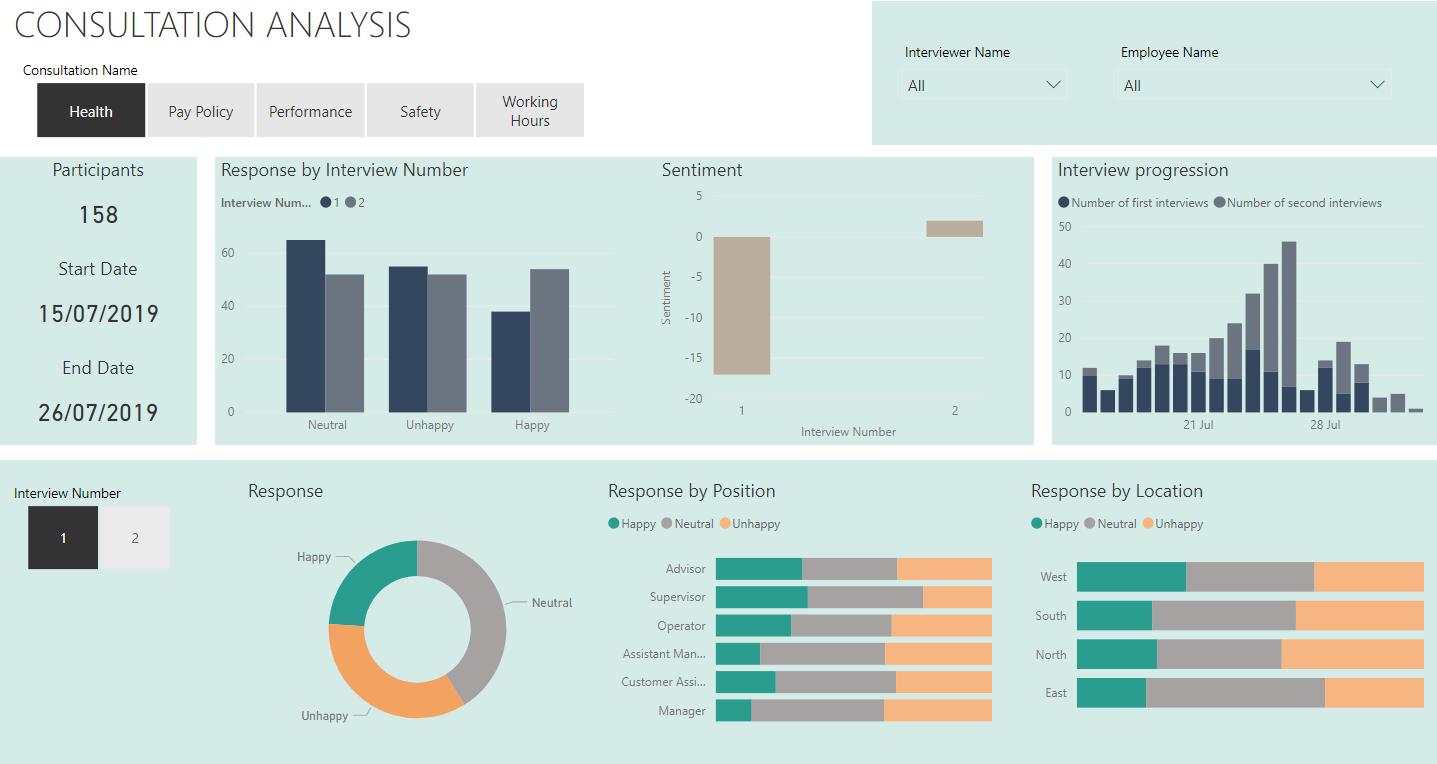
The design I have tried to keep clean and uncluttered whilst still showing all of the necessary insights and including all of the relevant data and breakdowns by location and job role etc.
The top section of the report shows data across both interviews and offers comparisons and the lower section is filterable by interview number and allows you to drill into the data.
I would have liked something more advanced for the sentiment chart or a more exciting way to display it but i was falling short with my DAX and decided to settle on simply creating a score that is count of happy - count of unhappy.