HR Consultation Insights - Power BI Challenge #3 Entry from Alexbadiu

Here’s @alexbadiu entry for Power BI Challenge 3. @alexbadiu, would you like to share how you built this dashboard and what your inspiration is in building it?

To learn about the real-life scenario presented for the challenge, be sure to click on the image below.

power-bi-chal-1

1 Like

Congrats on a really good submission to the power BI challenge.

I really like the simplicity of your report and it really tells a story within 10 seconds. I can also see you’ve used a lot of the best practices we’ve discussed within the training content, including; using a good colour palette, using labels and descriptions so it’s easy to understand as a consumer and easy to interpret also. This is so easy to look at as a analyst and make solid decisions based on it.

I love the way you have used the heat map. Not something I considered and I can’t actually see this and any other submissions. So something quite unique you’re created which I actually think showcases quite effectively, maybe more effectively, than any other visualisation I’ve seen.

Do you think you can detail your thought process around how you created this report? Also how did you actually create all of the interesting visualisations within the report?

I think there’s a lot of people who would really benefit from understanding some of the creative thinking you have implemented here.

Awesome work

Hello @sam.mckay!

I really wanted to participate to this challenge! I started working on a dashboard in Challenge 2, but didn’t manage to get it finished. So, this week, I worked on this project in a more organized manner in order to be able to deliver something.

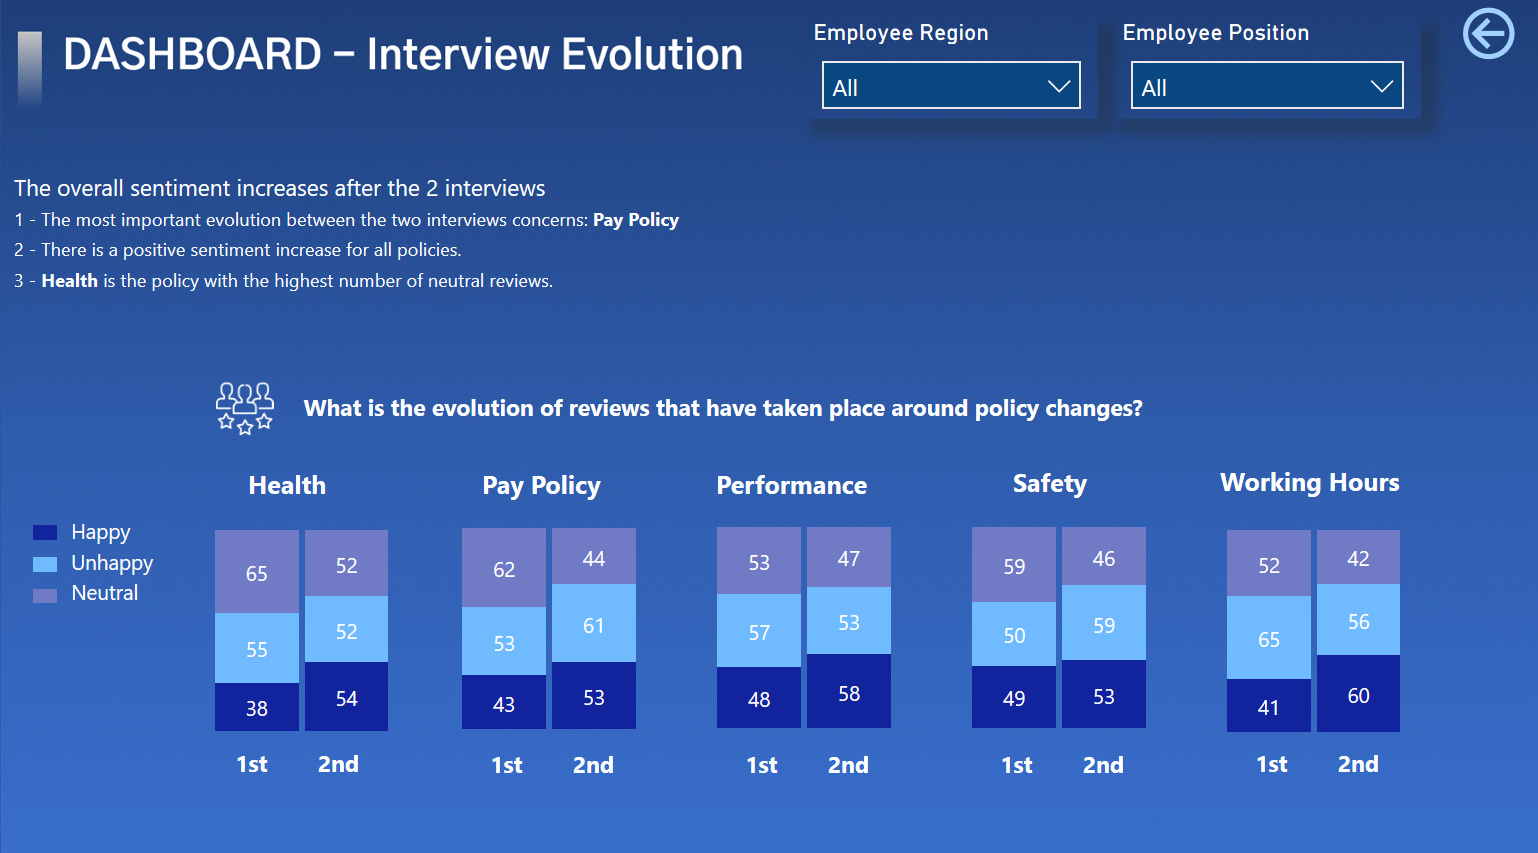
1 - I started looking at the data, trying to understand the information, trying to find the story I wanted to present. I always start asking the basic questions when trying to create a dashboard: why, when, where, who? I also read one more time the purpose of the challenge, so that I am not completly off subject
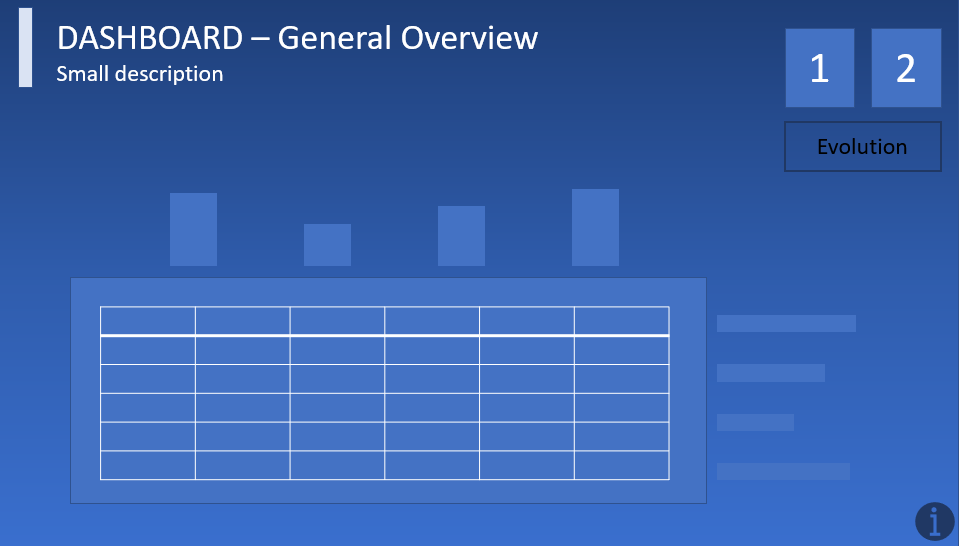
2 - I then started to sketch the report I wanted to create (in PowerPoint). I looked for inspiration on Pinterest and Dribbble. Finally, the inspiration came from my memory. I remember seing more or less a visualization like I created in the report being used in another vizualisation tool. Unfortunately, I don t remember the original author. I used this vizualisation on my first page because I wanted to create a report that is easily comprehensive, easy to build, and I also had the idea of using bookmarks. I used bookmarks to go along with my analysis comments in order to guide better the storyline and user experience. This way, I guide the user on the steps he/she needs to take, and the information I want to push forward. I also find it quite interesting that in a bookmark you can keep the highlight. It is an easy technique, but found that users generally like it.

“Attached the initial prototype I created using PowerPoint”


3 - Once I knew what I wanted to create, I started to work on my model. I tried to use as much as possible the best practices from the videos I watched on Entreprise DNA.
4 - After that I used Colour Theme Generator to find the right colour palette from the tools available in Entreprise DNA.
5 - I still had some ideas to go further into the data, but I did not have time to implement.
It was my first participation to the challenge, it was fun and stressfull a bit (the good kind of stress that makes you progress). I think it is the best way to learn.

Thank you Sam for organizing these challenges !
Best regards,
Alexandru

PS. I attach the .pbix file for those who want to see all details concerning my report

Challenge 3 A.Badiu.pbix (2.5 MB)

2 Likes

Nice one @alexbadiu

Great looking report. You mentioned attaching your .pbix but i can’t see it. Would love to have a look over it so see how you achieved what you did.

Nice one. I like the initial outline in PowerPoint. That’s a good idea.i would love to be able to create a simple technology for just this purposes. Simple mock ups for Power BI reports!

Sam

1 Like

@Luke, @BrianJ, I am uploading once again the .pbix in my post above. Hopefully it works this time! :slight_smile:

@sam.mckay, a technology for the sketching part would be very useful!

@alexbadiu,

Got it, thanks! Super cool how you constructed that heat map visual. It really looks like one integrated visual – I would not have guessed that it was a number of different components stitched together with a common look and feel. Great stuff. :+1:

Thanks for sharing.

  • Brian
1 Like