You cannot create this inside Power Bi native visuals.
I recommend not using so many pie charts in your page report.
It is hard for the eye, takes to much space on the screen and does not deliver a clear message as there are too many information at once.
I recommend focusing on only 1 KPI & 1 message for this chart: evolution of Total Costs, or Total Revenue, Or the ratio between Total Costs over Total Revenue.
I would focus more on the insights and less on showing all information.
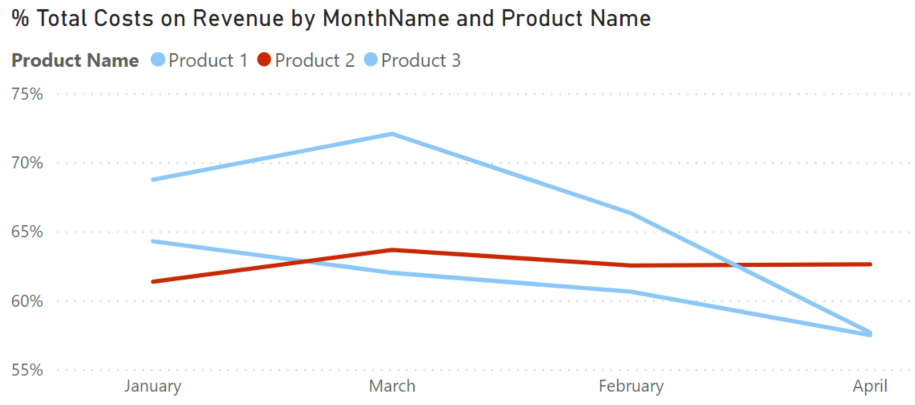
Ex: The ratio of Total costs over Total Revenue is decreasing for both product 1 and product 3 but increasing for product 2.
Best regards,
Alex