How to use measure as a slicer

Hello,

I have a question about how to use a measure as a slicer. A sample data is like this:

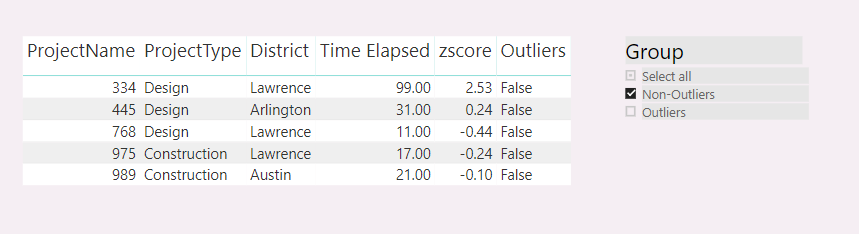
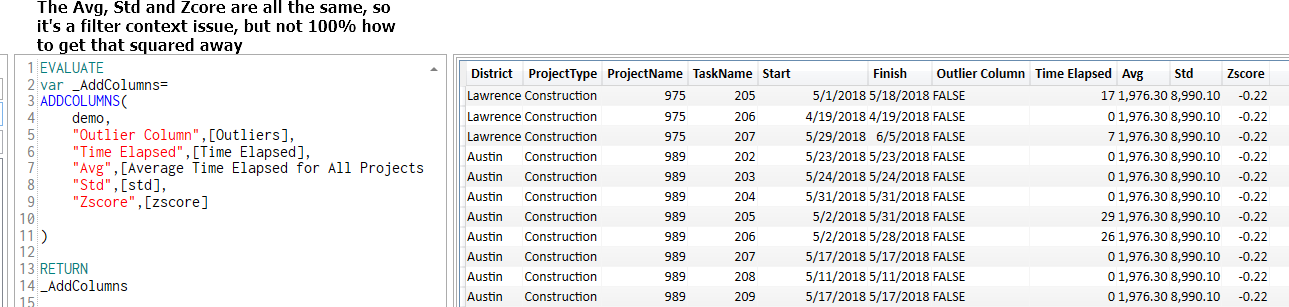
Where each project has its ProjectName, ProjectType, District, and Time Elapsed (how long it takes to finish). Time Elapsed is a measure. In order to find outliers, I calculated the Z-scores using the formula: (Time Elapsed-mean)/standard deviation. And Z-scores is also a measure. Then, I created another measure to indicate if it is an outlier based on the value of Z-scores, if it between -3 and 3, it is not an outlier, otherwise, it is. So far in the visual table, all measures showed the correct results. The next step I need is to be able to filter outliers and non-outliers using a slicer, which I am stuck. I watched the video of banding and segregating, and created a supporting table as below:

supporting%20table

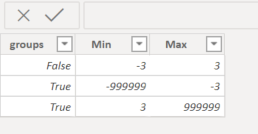
and use the following code to calculate Outliers:

Outliers = CALCULATE(
   SELECTEDVALUE('Outlier supporting'[groups],BLANK()),
   FILTER(ALL('Outlier supporting'),
   [zscore]>'Outlier supporting'[Min] &&
   [zscore]<='Outlier supporting'[Max]))

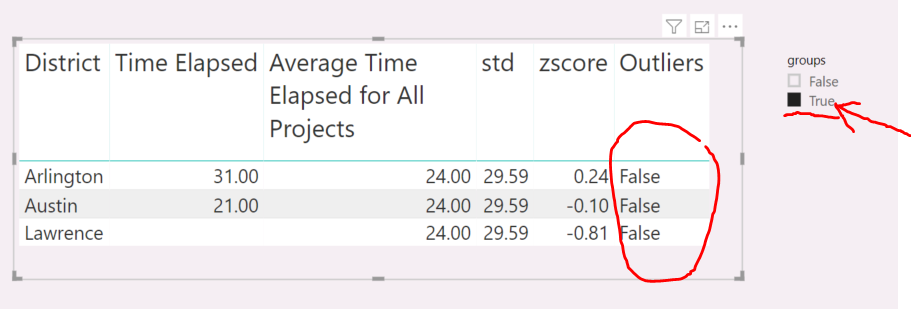
I used the group column as the value of a slicer, but it doesnā€™t work, it always showed all data no matter what I selected. I am wondering where I did wrong and how to fix this.

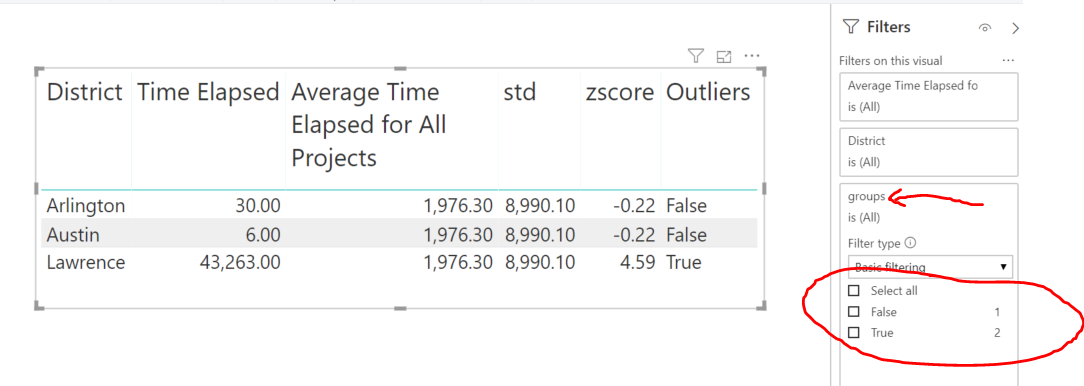
In addition, I also tried to use the Filters function, but when I click the Outliers tab, no options is showed up for some reasons.

Thanks!

This cannot be done. Filters ( including slicers) have to come from existing tables, which are only updated at data refresh and not when measures are called.

Enterprise%20DNA%20Expert%20-%20Small

There are several methods that could work around to achieve measure slicer if you search online. I watched this video from Sam


And tried to replicate the same technique. Basically, the measure is linked to a supporting table, and used the ā€˜groupsā€™ column from the supporting table as the slicer.

I see now. Yes, what the video shows is definitely correct since that is a physical table. Is there any chance you upload some sample data along with a quick mockup of what your expected outcome would be?

Enterprise%20DNA%20Expert%20-%20Small

Please find a sample file here:
20190830.pbix (339.1 KB)

What I am looking for is to be able to use the colunm ā€˜groupsā€™ as a slicer to select outliers, or non-outliers showed in the visual table. Currently as you can see below, this slicer did not work (True was selected but still showed data with non-outliers.

I also noticed the filter of groups did not show the correct values. There are three data points with ā€˜Falseā€™, but in filter, it showed one False, and two True points.

thanks!

@nainiu440,
Iā€™m taking a look and before I start, is it necessary for these to be installed to see your the issue you are having here?
image

Enterprise%20DNA%20Expert%20-%20Small

Hi,

I donā€™t think it is necessary since I did not plot anything, just a visual table. thanks!

@nainiu440
I figured, but wanted to make sure. Iā€™ve been looking at this a for a bit and to be honest this is a tough one. Iā€™m still not 100% sure this is possible, but I really feel like it should be. Iā€™m going to keep working on it and will revert back when I have something. I do apologize for the delay

-Nick

Enterprise%20DNA%20Expert%20-%20Small

thanks Nick. I just think the method I referred could be a great way to achieve measure filtering. but if it is too much of a hustle, is that possible to have two virtual tables, one for outliers and one for non-outliers? I uploaded my full data set. If you open it, you can see there are several card values (mean, 75 percentile, and counts). Originally, Iā€™d like to have a filter to select outliers and non-outliers, so that the values of these card could change accordingly. But if I can get two tables, one for outliers and one for non-outliers, and then calculate these values based two tables, will that be something more feasible? thanks!

@nainiu440
Thanks for the file. I will take a deeper look. One of the issues is that it looks like the average of what is selected is used in the calculations that lead to what is and is not an outlier. Unless I am mistaken on that part? If something is or is not an outlier then we can just store that as a calculated column and then we can filter that column.

Iā€™ve been thinking of ways to ā€œSendā€ the true/false of the outlier column to the table to be filtered, but still no such luck. My initial thought was to create virtual table using ADDColumns and then filter that, but getting stuck

But if we can store the outlier True/False into a calculated column it makes this process a whole lot easier.

Enterprise%20DNA%20Expert%20-%20Small

You are correct, outliers are based on what is selected and will change dynamically based on the filter selections. Thatā€™s why I used a measure instead of a calculated column. I am also watching several tutorials about harnessing virtual tables as a middle step, and then add filter/or do calculations based on that. I will keep posting if have any progress. thanks!

I really feel like thereā€™s a way to do this! Iā€™ll keep working on it too, because now it will just bother me till thereā€™s a solution :thinking:

Enterprise%20DNA%20Expert%20-%20Small

Hi @nainiu440 and @Nick_M,
Iā€™m not sure if I understand the question completely but, filtering a measure using a slicer is possible. Iā€™ve taken the liberty of downloading your sample file and re-working the calculations to demonstrate how it would work with your data (refer to Page 2). The filtering of the measure is created by this function.

Count of Tasks with Outlier Filter = 
Var Dist_Table = 
ADDCOLUMNS(
    SUMMARIZE(demo,
    demo[TaskName]),
    "Test", [Outlier Test]
)
return
SUMX(
    FILTER(Dist_Table,
    CONTAINSROW( VALUES('Outlier supporting'[groups]), [Test])),
    1
)

I also simplified the Outlier measure to this.

Outlier Test = SWITCH(TRUE(),

And([New Z Score]>-1,[New Z Score]<1),ā€œFalseā€,

ā€œTrueā€)

and when you want to filter a measure you would apply it like this.

Task Start with Outlier Filter =

CALCULATE([Task Start],
FILTER(
VALUES(demo[TaskName]),
NOT ISBLANK([Count of Tasks with Outlier Filter])
)
)

Iā€™m not sure that this completely answers the question because I donā€™t understand the relationship between ā€œDistrictsā€ and ā€œProjectsā€ with the ā€œTaskā€. Let me know if you have any questions. 20190830.pbix (358.0 KB)

@Steve
That is awesome! Iā€™ll let @nainiu440 confirm if this meets the requirements or not. but even if it doesnt itā€™s still great work. I will definitely file this one away as I honestly was having a few issues trying to solve this. But thatā€™s the great thing about this community. Itā€™s impossible to know it all, but get a good group of people together and bound to find a solution.

Enterprise%20DNA%20Expert%20-%20Small

1 Like

Hi @Steve and @Nick_M, thanks for your efforts, and I think Steveā€™s method is getting me there. However, I cant get the key filtering measure working correctly. When I add this measure, it gives me error of ā€˜canā€™t display the visualā€™.

I understand that we created a middle table ā€˜Dist_tableā€™, and using SUMX to mark False with 1 and True with blank. But could you please explain this part?

I thought VALUES(ā€˜Outlier supportingā€™[groups]) should be {ā€œTrueā€, ā€œFalseā€}, so does [Test], so what did the filter function actually for? I tried to replace this to SUMX( FILTER(Dist_Table, CONTAINSROW( {ā€œTrueā€}, [Test])), 1 ), the display error is gone, but the whole column is blank. I think if I can get this measure working, the rest will be easy. thanks again!

Hi @nainiu440 and @Nick_M, please find attached the updated file. The correction required was to convert the ā€œgroupsā€ field in the Outlier supporting groups table to a text field. The reason you do this is true or false need to be a label, not a Boolean test. data draft-part 1_test.pbix (1.6 MB)

However, I since found that was an issue with the calculation when Task Name is included in the level of detail. The duplicate tab contains the amended version. the screenshot below explains the difference in approach.

Iā€™ve also made amendments to the [mean], [Std] and [Actual_Duration_Zscore] where [mean] and [std] now measure the mean and std deviation over all projects and the Z score measure is now in 2 versions one being for the task and the other for the project. The project Z score is used as the value to filter the projectname slicer. Both versions of the Z score are in the table as a reference.

You had a question about the Countrows filter? It sets up a condition which allows you to filter the virtual table using the disconnected table (ā€˜Outlier supportingā€™[Group]) values as input. Itā€™s similar to the DAX pattern of;

Filter( Dist_Table, [Test] In Values(ā€˜Outlier supportingā€™[Group])

Let me know what you think.

So the mean, std, zscores, and outliers should be calculated dynamically based on what data set is selected using slicers on the top. Thatā€™s why I used ALLSELECTED() to calculate mean and std.

I did change the column type to text, and the visual error is gone. However, currently it gave me 1 for both ā€˜trueā€™ and ā€˜falseā€™. So when use this filter:

It actually does not filter anything because [Test] include ā€˜Trueā€™ and ā€˜Falseā€™, and so does Values(ā€˜Outlier supportingā€™[Group]), and thatā€™s why all data have a value of 1. Did I understand this wrong?
thanks!

Hi @nainiu440,
The filter allows you to select Projects that are True, False or both (all).

The problem with the model is the use of the Allselected(Table) measures. The test returns the the status of each project based upon the selected project and tasks (which is what you want). However, when you filter the projects to display only say those that are ā€œTrueā€, the [std] and [mean] measures also change to reflect the new filter condition which in turn changes the Ztest measure.

Hi @Steve, I am still a little confused, so through the filter projects with true, false, or both were selected, and then use SUMX to give all of them a value of 1?

You are right about using Allselected(), and there is indeed a such conflict. If I add something like ALL(groups) to the mean and std formulas, excluding groups filter from calculating results, does it sound feasible? Thanks!

Hi @nainiu440,
With respect to the filter, donā€™t consider True or False as Boolean conditions, they are only labels. You can achieve the same filtering behaviour with different labels. You could change ā€œTrueā€ to ā€œOutlierā€ and ā€œFalseā€ to ā€œIn Specā€ in the test measure. You would need to change the disconnected table labels to ā€œOutlierā€ and ā€œIn Specā€ as well but, when you choose ā€œIn Specā€ from the slicer only the ā€œIn Specā€ (AKA ā€œFalseā€)are displayed. When you choose ā€œOutlierā€ only the ā€œTrueā€ is displayed and when the slicer has no selections, both ā€œOutlierā€ and ā€œIn Specā€ are displayed.

Iā€™ve given some thought to the potential solution and yes, what youā€™ve indicated is one solution. However, it wonā€™t be as elegant as you would like it to be. The problem is the change in the context created by Allselected() functions when the table is further filtered further from the project level. Iā€™m thinking a pattern like this may do the trick for the [mean] and [std] measures;

Task Mean = CALCULATE([Mean],
Filter(ALL(ā€˜Master_Tableā€™),
Master_Table[TaskName] = Max(Master_Table[TaskName]))
)

This will fix the task mean and std deviation to the tasks selected and should not change when you filter down to individual projects and tasks.

Attached is a Power BI model I created from your data as an example of how it could work. You will notice Iā€™ve changed the structure a bitā€¦ I strongly suggest the use of Power Query to shape your data into Lookup and data tables, it improves performance and compression. Let me know what you think.
Project Model.pbix (224.9 KB)

1 Like