How to Sum total from each group

Hi, Guys,

Hope you all doing well. I have a challenge and I hope you can help me with this calculation. I have a table with with a unique value for each group and I’d like to know how to do the SUM of the value from each group.

Here is a sample table I have.
image

What I want to do it using DAX to have the following result.
image

I have managed to create a DAX to do the SUM for each of the region.
Qty =

Var Temp = Maxx(DISTINCT(Table1[Region]), MAX(Table1[Qty]))

return

Sumx(DISTINCT(Table1[Region]), Temp)

But I don’t know how to use DAX to calculate the Total (in this case, the total is 17).

If you have any idea on how to do it, it will be greatly apprecaited.

Thanks!

Mike

Hi Mike,

Can you please send the pbix file?
It would be much easier to give you a hand :wink:

Take care,
Mariusz

Hi, Mariusz,

Thanks, here is the pbix file.

Mike
Sample_file_for_Sum.pbix (18.7 KB)

@Mike,

Give this a go:

Summ Tot = 

VAR vTable =
    SUMMARIZE(
        Data,
        Data[Region],
        Data[Qty]
    )
    
VAR Result =
IF(
    HASONEVALUE( Data[Region] ),
    MAXX(
        vTable,
        Data[Qty]
    ),
    SUMX(
        vTable,
        Data[Qty]
    )
)

RETURN
Result 
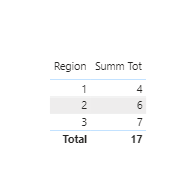
image

I hope this is helpful.

  • Brian

PS - @Greg has put together a treasure trove of information on fixing incorrect totals in the DAX Patterns section of the forum (see link below):

Thanks, Brian, so you created a virtual table for the calculation. That is a great idea!

Mike

Thanks, Brian for sharing this detailed information, It looks like that the information is quite heavy. I will take time to read it carefully and hope I can understand more about DAX.

Thank you very much for your help!

Mike

@Mike,

That’s the general approach for fixing almost all incorrect total issues. Some people like to embed the virtual table within a SUMX statement. Just as a matter of style, I prefer to create the explicit virtual table as a variable and then manipulate is via HASONEVALUE , ISINSCOPE and/or HASONEFILTER.

The former approach looks cleaner for table total issues, but I think the latter approach shines in fixing more complex matrix totals.

  • Brian

@Mike,

Mastering virtual tables take some work, but once you get it you will feel like you’ve acquired a DAX superpower. If you have any questions as you work through it, just give a shout – that’s what we’re here for.

@sam.mckay has a bunch of great videos on virtual table techniques. Just search the Enterprise DNA Content in the forum search function, and you’ll get a whole list of them.

  • Brian

Awesome, Brian. Thanks for sharing the technique and the tips with me. I started to use HASONEVALUE a lot, but have not started thinking about creating a virtual table in my DAX practice. Your way to do the calculation is much easier to understand comparing to what I found on other Internet sites.

Thanks again and have a nice weekend ahead!

Mike

1 Like

Mike, Brian,

It seems I was too late for the party :joy:

Brian - great job!
However, one remark. I can see inconsistency in the measure.

On the row context the MAX quantity of the region is calculated.
On the TOTAL context the SUM quality of all products is calculated,

Te result is correct because the quantity of all products per region is the same.
If the source data are different the result is different.

The question to Mike what should be calculated on the row context as well as on the total.

Different source data:

image

The outcome:
image

38 seems odd as a result (6+10+7 = 23).

Different measure which SUM the MAX of each region:

Qty (
    MAX row ocontext
    AND SUM of MAX IN total
) =
VAR Temp = Maxx (
    DISTINCT ( Data2[Region] ),
    MAX ( Data2[Qty] )
) 

RETURN
IF (
    HASONEVALUE ( Data2[Region] ),
    Temp,
    SUMX (
        SUMMARIZE (
            Data2,
            Data2[Region],
            "@max", CALCULATE ( MAX ( Data2[Qty] ) )
        ),
       [@max]
    )
)

Once again, everything depends on the assumptions of the calculation :wink:

Take care,
Mariusz

Hi, Mariusz, that is great! The scenario you brought up could happen. When I post my question, I was trying to make the case as easier as possible. I have not taken a deep look into my raw data yet, but I could run into the challenge as you mentioned. I am glad that I will have two solutions next Monday. Regardless what the challenge I could face, I know I have already had my answers.

Thanks both for your time and help!

Mike

@mno,

As I understood the problem, I believe my measure still provides the correct result:

image

My understanding was that Mike was looking to total the unique pairings of region and quantity. If that’s not the correct interpretation, then you are right that the measure will need to be revised.

Good discussion either way though – thanks.

  • Brian

@BrianJ,

You are right, great job - thanks!

Have a good weekend.

Mariusz

I maybe late to party but if what you’re looking for is the unique value combination, you should do it in power query instead of dax. Your source data is denormalize and showing replicate values