How to showcase Budgets vs Actuals to today's date

I’ve watched a lot of Sam’s tutorials on Budgeting. It has been extremely useful. Although in all of his examples, he sets a Budget, but then the comparison of Budget V Actual is already complete at end of year. I’m wanting to compare Budget V Actual, at any point in time to see how you are tracking (Further drill down by Product to see where budget is not being reached). You obviously get a reasonable visualisation of this with Cumulative Budget and Cumulative Sales on a line graph.

So to calculate Total Sales to Date.
= IF(LASTDATE( Dates[Date] ) > TODAY(), BLANK(), SUM('Sales'[Net Amount]) )

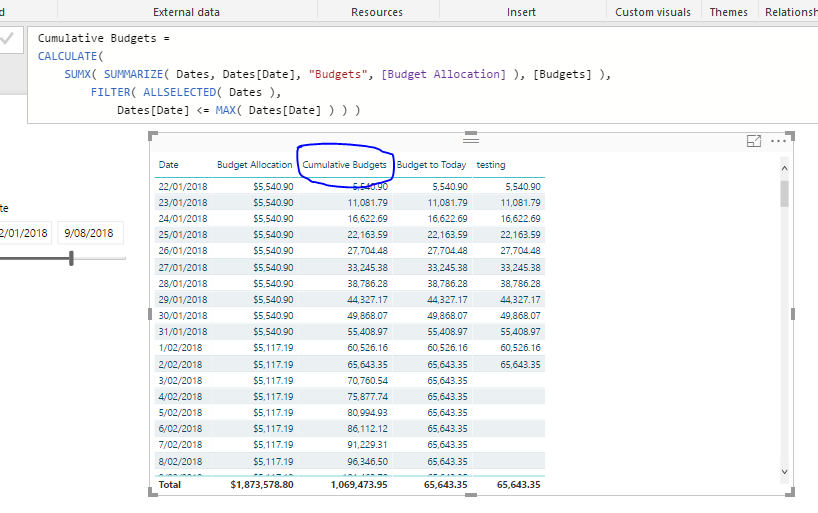
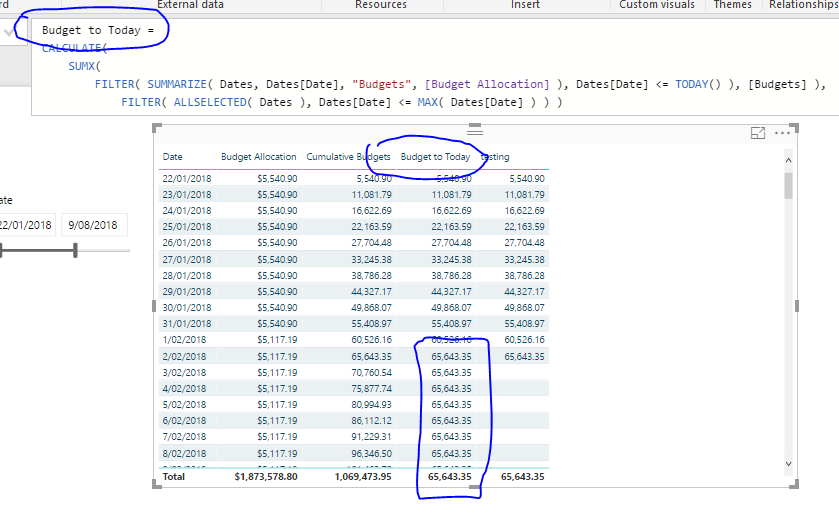
But then I cannot do the same for my 2018 Budget, as obviously there is transactions all the way through the 2018 FY period in this table. So I need the Budget to date … Having some trouble getting this outcome.

I can use month filters to get end of month differences, but prefer something dynamic at any point in time.

Any help would be great.

Check out this video - I describe how to solve this here

1 Like

You’ll just have to make sure to utilize the cumulative budget formula from the recent workshop I put on.

This formula is a little more complex as you have to use virtual tables to iterate over the budget allocation. But I detail in here.

So it will be a combination of the two techniques from both these videos

1 Like

Can also find the replay here, including the download of file with all formulas etc

Hey Sam, just made a Video to explain. Thank you. Cam.

Is your cumulative budget using function “ALLSELECTED”

Something as simple as this should fix the cumulative result

Cumulative To Today = 
IF( LASTDATE( Dates[Date] ) > TODAY(),
	BLANK(),
		[Cumulative Budgets] )

I think you’ve got the budget allocation in there rather than the cumulative one. Try that.

I just mocked it up and this formula worked on the cumulative total

Let me know if I’ve missed something. Chrs

Just of note for me as well, do you get an email when a reply is placed into your thread?

Hi Sam, I received an email when Gary responded. Then with the browser open to the page, I did not receive an email for your response, but the notification popped up in top right corner.

Returning blank for me

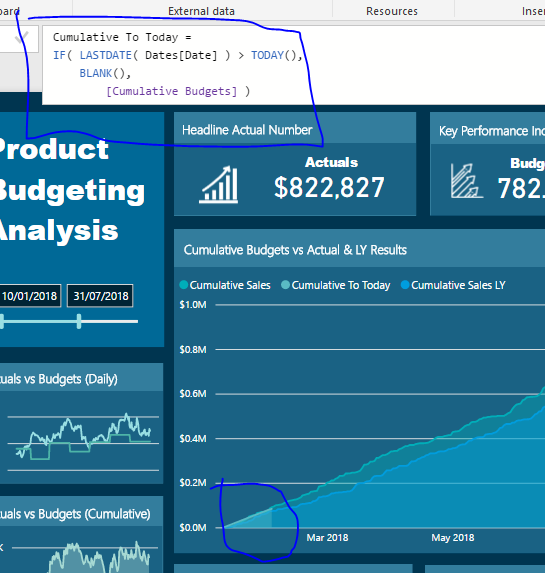
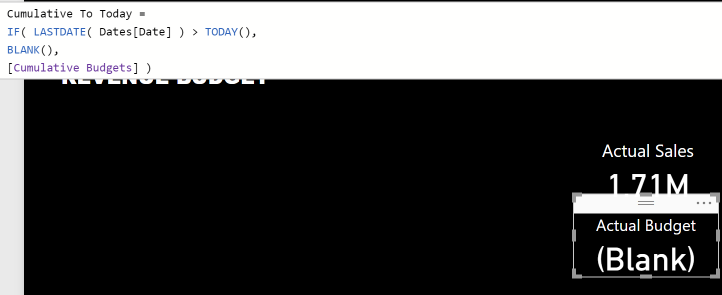
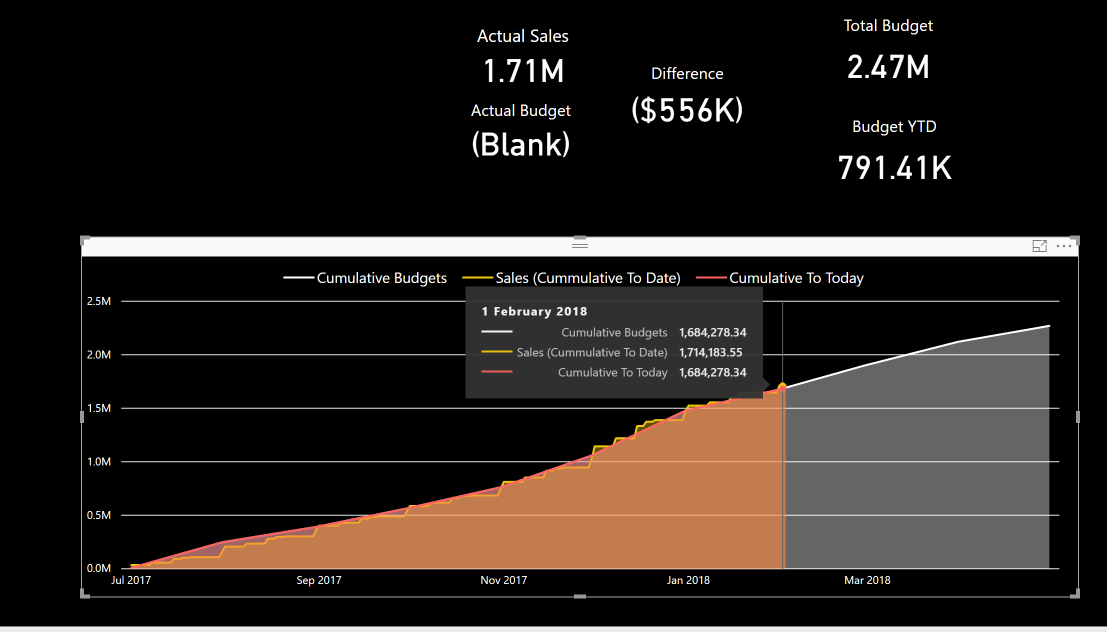
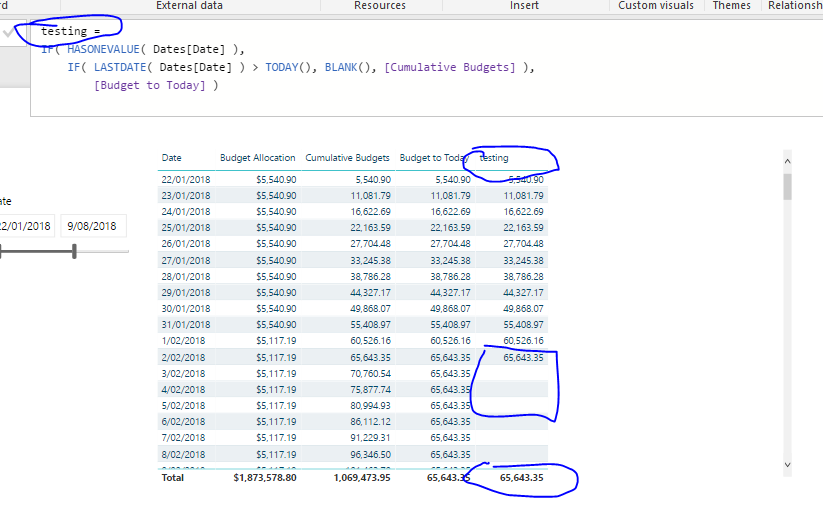
The way you have shown it Sam. Yes, no problem, see screenshot, I can stop the Cumulative Budget on the Line Graph at Today(). See below in Orange. But how do I show that actual figure in a Card?

Yep just noticed this in mocking it up on my side. Well be back shortly will something.

1 Like

Ok so I have a solution. There is honestly probably a more elegant one, but this is what I have for now and it works, so that’s the main thing.

So, you’ve already got cumulative budgets. So leave that as is.

Now create another measure like this. (It’s the same pattern but you’ll see that I’ve added a FILTER around SUMMARIZE)

Then last we need the master measure that uses both of these to check if we require it within a visual or as a total, like the below

I think this should do, let me know if not.

There’s a bit to it I know.

I’ll look to discover a more elegant solution in time that solves this a bit better.

Thank you Sam! That worked exactly as I was after.

As you can imagine this is immensely more powerful as a card in a Dashboard. Dynamically over time, you can open your Dashboard and see how you are tracking against Budget at that point in time without having to worry about the date filter and context, etc. Ie. You do not need to open a report, it can be pinned as a tile.

Yes, agreed. Work well that way

1 Like