Hi,
I have data like this.
When I use the Narrative functionality in Text box, I get only the first value in the column ‘Action’. For the same Objective in Column A, how can I refer to the 2nd value in the column ‘Action’?
Regards,
Deb
Hi,
I have data like this.
When I use the Narrative functionality in Text box, I get only the first value in the column ‘Action’. For the same Objective in Column A, how can I refer to the 2nd value in the column ‘Action’?
Regards,
Deb
Hi @DebSJ. Create a measure to retrieve the value of interest, then use the measure in your narrative textbox.
Greg
Hi @Greg,
Thank you for your response.
Kindly elaborate the step needed to create the measure for a text column. So, based on Objective selected in a Slicer, I should be able to retrieve all the values in the column ‘Action’ in my narrative. An Objective can have varying number of Actions.
Best regards,
Deb
Hi @DebSJ,
That logic would depend on your data… with the 2 rows supplied, this would do this trick.
Simple = MIN( YourTable[Action] )
and
Complex =
VAR _Obj = SELECTEDVALUE( YourTable[Objective] )
RETURN

    MINX(
        FILTER(
            YourTable,
            YourTable[Objective] = _Obj
        ),  [Action]
    )
Did I misunderstand? Do you only need the second value OR would you need all values?
If you need all values then you would need CONCATENEX
All =
VAR _Obj = SELECTEDVALUE( YourTable[Objective])
RETURN

CONCATENATEX(
    FILTER(
        YourTable,
        YourTable[Objective] = _Obj
    ),  [Action], "," &UNICHAR(10)
)Hi @DebSJ. Enterprise DNA has many resources available that discuss measure use. If you haven’t already, be sure to review the 2 ultimate beginner’s guide courses.
Hope this helps.
Greg
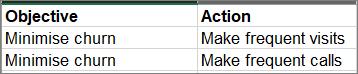
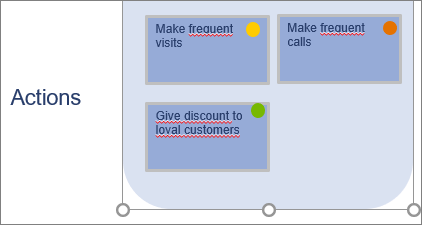
Actually, I somehow need to get the values in the column ‘Action’ separately. An Objective can have multiple Actions. I initially had gone for Multi-row card, but the only problem is that it does not have text wrap option, so text gets cut off incompletely (I do have long text with 5-10 words, here just gave sample). Therefore, I thought if I could use Narrative to sort out this problem. Since the number of Actions can be varying, I cannot create static number of cards. Reason why I cannot use just a Table to show these values is because the requirement is to show these Actions in separate bubbles. There is also a 3rd column : Status (shown with color circles).
So, for a selected Objective for a selected time period, if it has 3 Actions, then I need to show them somewhat like below:
Truly thankful for your tips!
Best regards,
Deb
Hi @DebSJ.
To help us further analyze your current state and visualize your issue, could you please provide as many as you can of:
Also, if you provide DAX or Power Query code in your post, please format it using the built-in formatter.
Greg
Hi @DebSJ, following up your masked work-in-progress PBIX file, dataset as an Excel file, and a detailed mock-up (marked-up screenshot of the visual in question or Excel file) showing your desired outcome.
The users and experts need the above information to help you further with your query. Thanks!
Hi @DebSJ, we’ve noticed that no response has been received from you since the 19th of May.
We are waiting for t your masked work-in-progress PBIX file, dataset as an Excel file, and a detailed mock-up (marked-up screenshot of the visual in question or Excel file) showing your desired outcome.
In case there won’t be any activity on it in the next few days, we’ll be tagging this post as Solved.
Hi,
Sorry for the unintentional delay in getting back. Please find attached the excel file and PBIX file. In the PBIX file, I have mentioned the desired outcome. Truly thankful for your help.
MockUp_GoalsActions.xlsx (11.9 KB) MockUp_GoalsActions.pbix (36.3 KB)
Best regards,
Deb
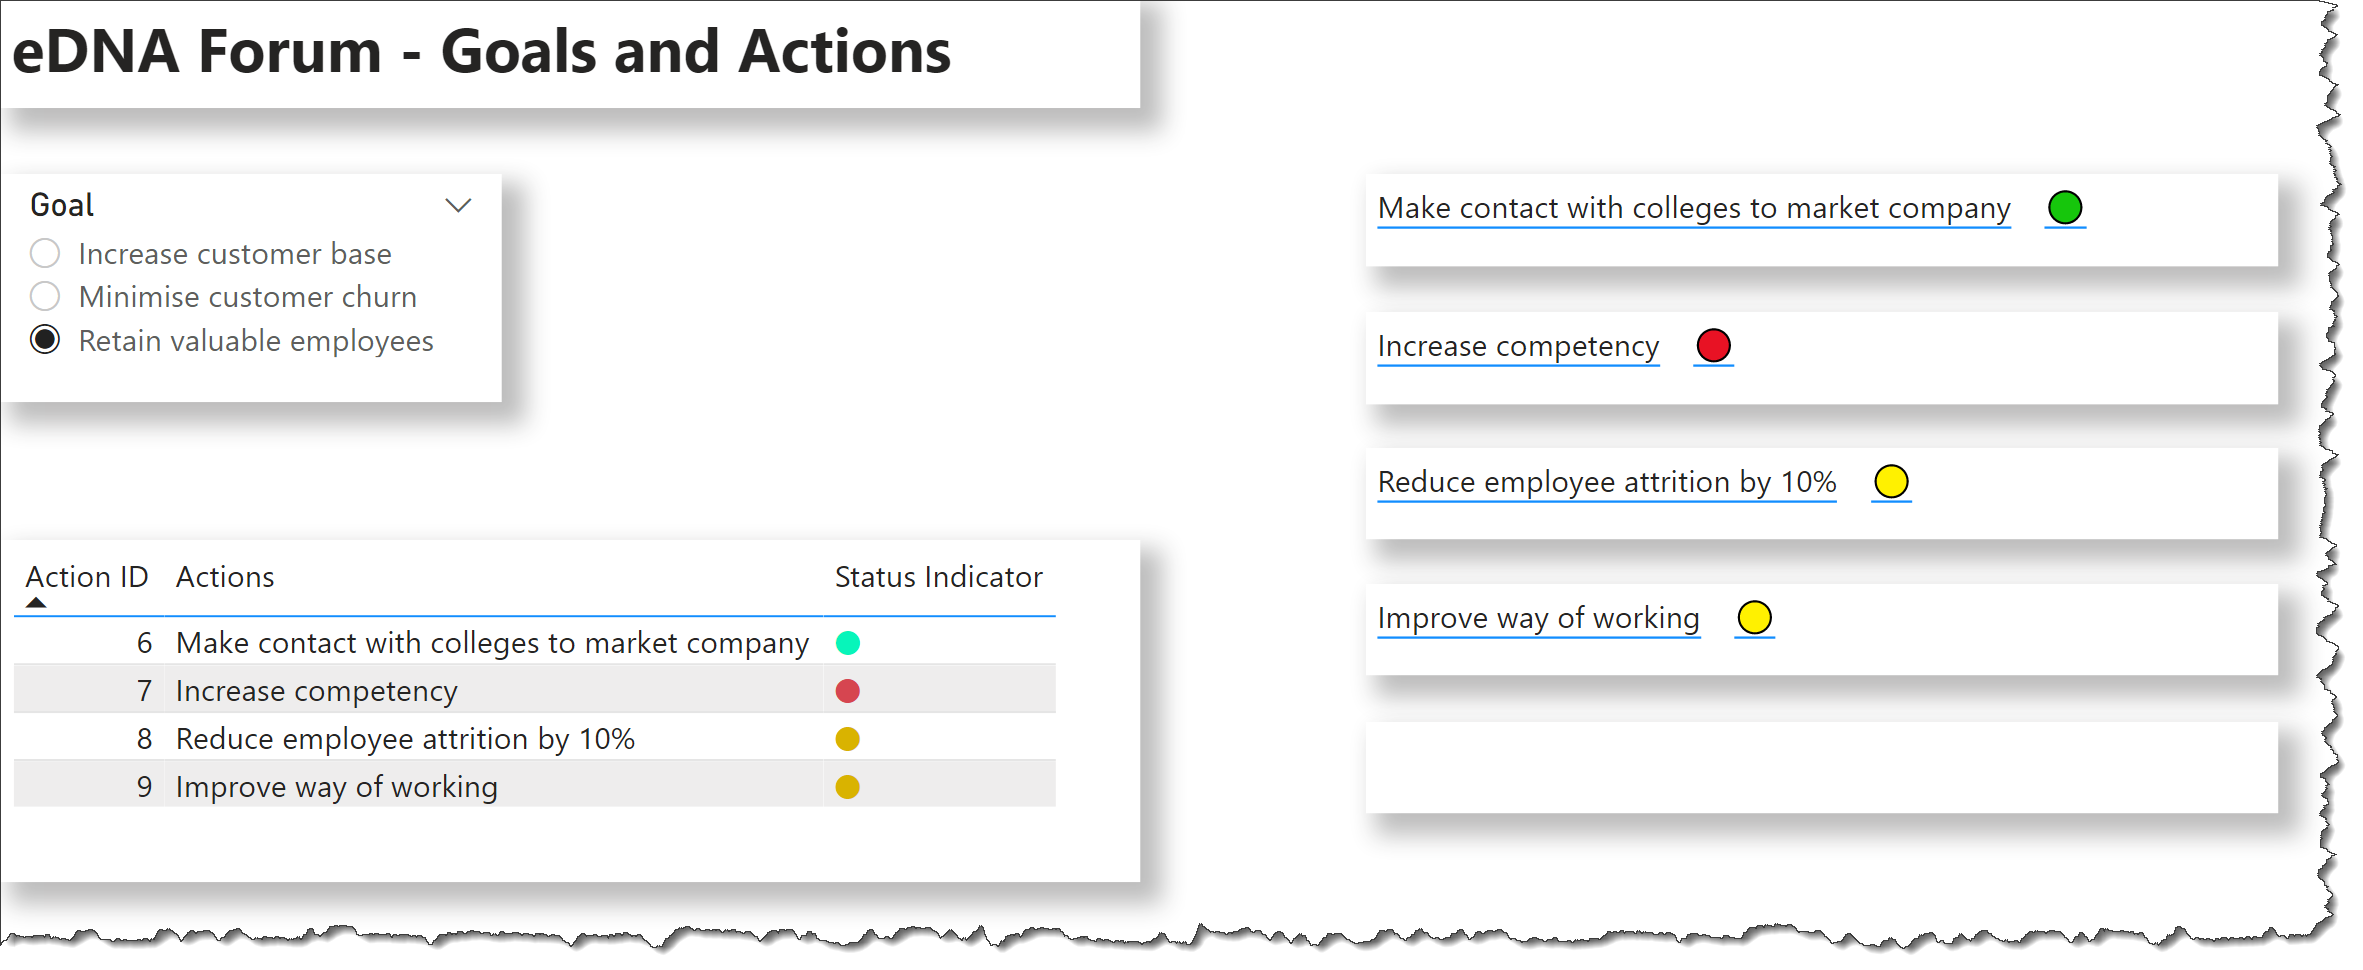
Hi @DebSJ.
One way to get something different would be to use textboxes with 2 measures each, one for the action, and one for the status icon, to give something like:
You could create measures for each action #, status #, something like
Action 2 =
VAR _ActionNumber = 2
VAR _GoalID = SELECTEDVALUE( Goals[Goal ID] )
VAR _MinActionID = MIN( Actions[Action ID] )
VAR _Result = CALCULATE(
    MIN( Actions[Actions] ),
    FILTER(
        Actions,
        Actions[Goal ID] = _GoalID &&
        Actions[Action ID] = _MinActionID - 1 + _ActionNumber
    )
)

RETURN
_Result

Status Indicator 2 =
VAR _ActionNumber = 2
VAR _GoalID = SELECTEDVALUE( Goals[Goal ID] )
VAR _MinActionID = MIN( Actions[Action ID] )
VAR _Status = CALCULATE(
    MIN( Actions[Status] ),
    FILTER(
        Actions,
        Actions[Goal ID] = _GoalID &&
        Actions[Action ID] = _MinActionID - 1 + _ActionNumber
    )
)
VAR _Result = SWITCH(
    TRUE(),
    _Status = "Finished", [Green Circle],
    _Status = "In progress", [Yellow Circle],
    _Status = "Not started", [Red Circle],
    BLANK()
)

RETURN
_Result
For the status icons, you could leverage the DAX UNICHAR function to create the “icon/colour” measures, something like:
Red Circle = UNICHAR( 128308 )
Green Circle = UNICHAR( 128994 )
Yellow Circle = UNICHAR( 128993 )
Hope this helps.
Greg
eDNA Forum - Goals and Actions.pbix (39.7 KB)
Thanks a lot @Greg 
 . This is what was expected, and you have presented such an elegant solution, an excellent learning for me too. Kudos to you!