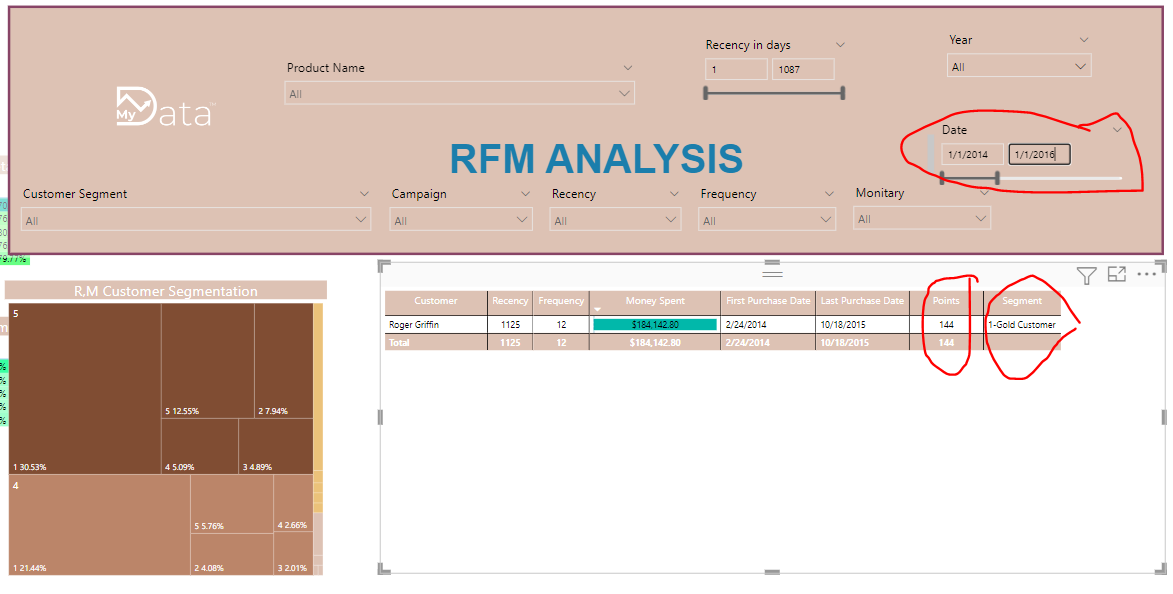
Here, I’m trying to set up an RFM on Power BI. But the problem is that I want the label of the segment to be different depending on the period and/or product and/or recency in days. Or For example, to go from an annual label to a monthly label, I tried different ways but nothing works , so please help.
Example :
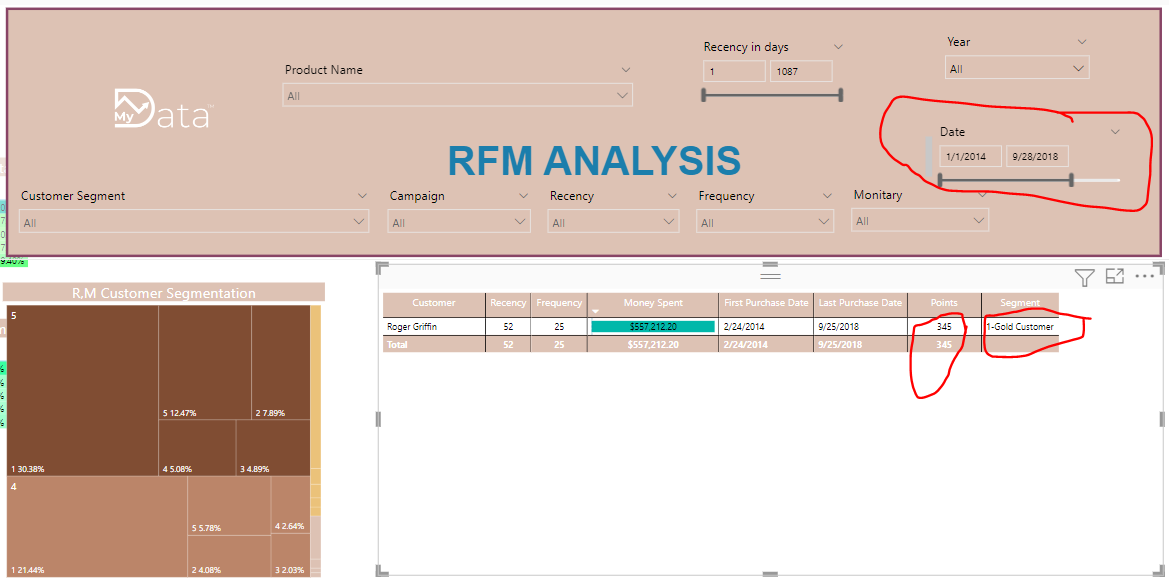
Please look at the screenshot Customer name : Roger Griffin ,
Case - 1
The customer considered Gold because the points are very high (Thats ok)
I solved the problem in two ways. In one I use a measure with a SWITCH( TRUE() ) statement. Other is a more m-query way in combination with a LOOKUPVALUE. The latter introduced some errors in your visualizations. I fixed that for the most, but not for all, but I think you can fix it easily as well (if not, I can help you problaby on that one)
Everything I implemented has the name DM… & something.
I don’t know if you can follow my steps in the query editor. If not, just ask and I am happy to assist further.
I am not really sure whether this solution is called best-practice. So I invite anyone else who reads this to maybe verify my procedure that would be nice.
For the file (Solution RFM 1) it is clear for me , (Solution RFM 2) it might be more useful but I don’t know Can you give me an explanation of the solution I mean (Solution RFM 2) ?
Open power query editor and navigate to customer class sheet
Replaced the 10.000.000 value with a more reasonable number of 10.000, since I assume it’s some sort of an upperlimit.(Step: ReplacedValue21)
I make a list, which I would like to expand. This list contains every number between the lower and upperlimit of a certrain row. I created this with List.Numbers([Min] , [Max]-[Min], 1 ) (Step: Added Custom)
Now I can expand this list to new rows, so we have a row for every value of the RFM score to which we can link. (Expanded DM key). Basically you could rmeove the min and max afterwards to clean up the model.
Press Close & Apply and go to your report.
In the report create a measure with LOOKUPVALUE().
Last step, replace the errors which occorued due to the process exlained.
I think I have completed step 7 now (see attachement) Solution RFM 2.pbix (1.6 MB)
. But be aware, I don’t understand the language used in your report. So, make sure to check yourself if I replaced everything correctly.