Hello! I am trying to create a pareto chart following Enterprise DNA’s awesome tutorial
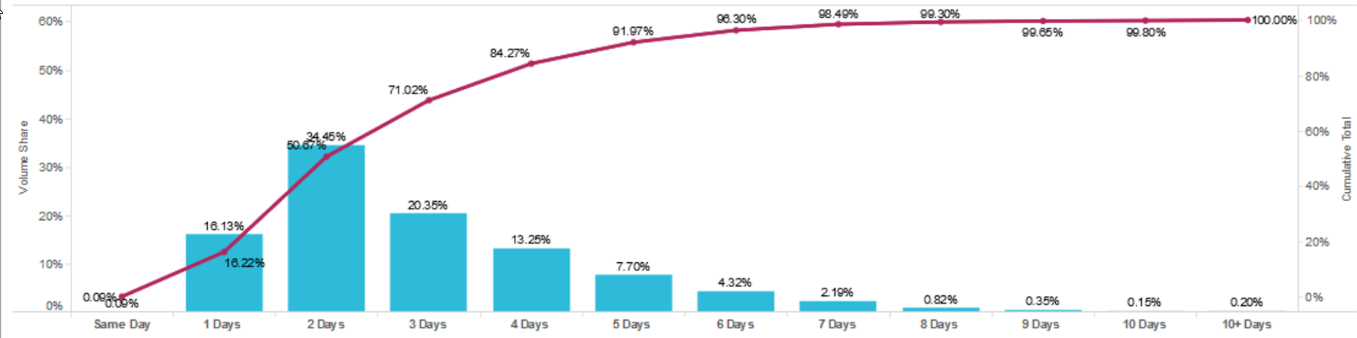
https://www.youtube.com/watch?v=rlUBO5qoKow but instead of having “State code” on the X-axis I would like to display a few measures. (Below is desired result/inspiration)
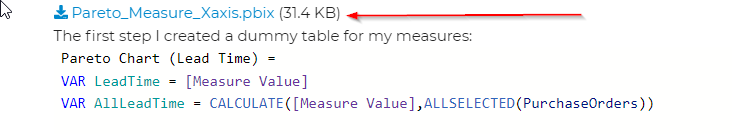
Pareto_Measure_Xaxis.pbix (31.4 KB)
The first step I created a dummy table for my measures:
The second step I created a calculated measure:

  Measure Value = SWITCH(
    SELECTEDVALUE('LeadTimeTable'[Lead Time]),
    "Same Day",sum(PurchaseOrders[Same Day]),
    "1 Days",sum(PurchaseOrders[1 Days]),
    "2 Days",sum(PurchaseOrders[2 Days]),
    "3 Days",sum(PurchaseOrders[3 Days])
)
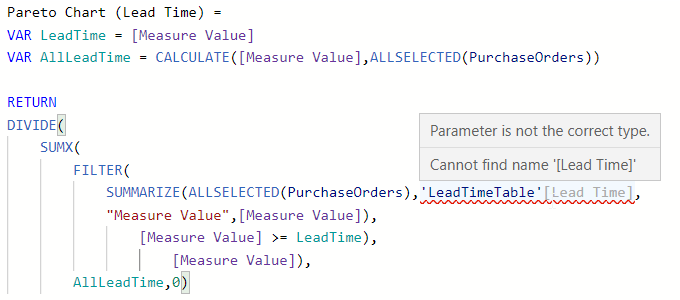
The third step I created pareto measure:
Pareto Chart (Lead Time) =
VAR LeadTime = [Measure Value]
VAR AllLeadTime = CALCULATE([Measure Value],ALLSELECTED(PurchaseOrders))

RETURN
DIVIDE(
    SUMX(
        FILTER(
            SUMMARIZE(ALLSELECTED(PurchaseOrders),'LeadTimeTable'[Lead Time],
            "Measure Value",[Measure Value]),
                [Measure Value] >= LeadTime),
                    [Measure Value]),
        AllLeadTime,0)
But the dax code complains that it cannot find the column “Lead Time” in the LeadTimeTable. I am wondering if that is because there is no real relationship created between the dummy table and the PurchaseOrder table and therefore cannot be referenced.