Hi folks,
I have two tables i.e Sales and date table and I have also built a relationship between these tables using the common field Date.
In sales table I have sales data till July 2020 and I want to use Sales Data of July 2020(Latest Month) for the remaining months(Aug,Sept,Oct,Nov,Dec)
I am attaching the image below of the expected output.
Thanks in advance
Hi @ajinkyakadam0009,
Welcome to the forum!
I trust you will find the technique explained here by @sam.mckay helpful.
You can use the Search option in the top right to search for additional resources covering Budgets.
If you need additional support after viewing this please provide a sample PBIX file, so members can better assist you.
Thanks!
I saw the video. It did not helped me![exp|410x120] . I am using this Dax expression but however, it is not giving me the expected output.
 Testing = var currentmonth =MONTH(LASTDATE('Raw Data'[Date]))                                                                                          var currentyear = YEAR(LASTDATE('Raw Data'[Date]))
    var enddate = LASTDATE('Raw Data'[Date])
    var startdate = DATE(currentyear,currentmonth,1)                                                                           return
     var remainingmonths = CALCULATE(SUMX('Raw Data','Raw Data'[Sales]),'Date'[Date]>=startdate,'Date'[Date]<enddate,ALLEXCEPT('Date','Date'[Date]))
     return
      IF(ISBLANK([Total Sales]),remainingmonths,[Total Sales])
Hi @ajinkyakadam0009,
With the limited information provided I’ve made a model for you. This includes a Date table that’s also been marked as a Date table.
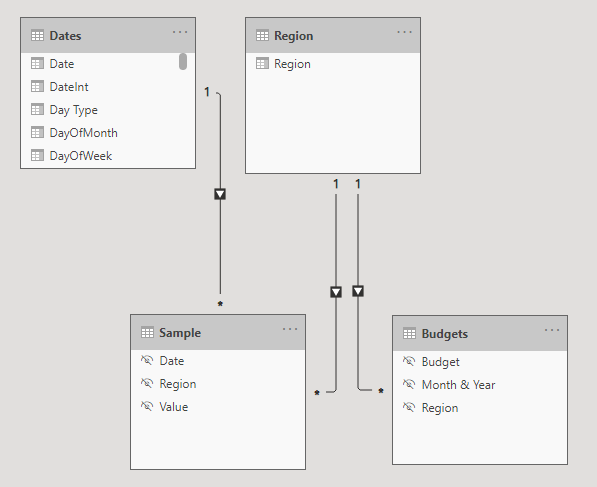
With the technique shown in linked resource, built a Budgets table.
Budgets =
VAR myYear = YEAR( [LastSalesDate] )
VAR myMonth = MONTH( [LastSalesDate] )

RETURN
ADDCOLUMNS(
    CROSSJOIN(
        CALCULATETABLE(
            VALUES( Dates[Month & Year] ),
                Dates[Year] = myYear,
                Dates[MonthOfYear] > myMonth
        ),
        VALUES( 'Sample'[Region] )
    ),
    "Budget", CALCULATE(
        SUM( 'Sample'[Value] ),
        FILTER(
            Dates,
            Dates[Year] = myYear &&
            Dates[MonthOfYear] = myMonth
        )
    )
)
Notice that there’s no relationship between Dates and Budgets because they are at a different granularity. So the measure for Total Budget then becomes:
Total Budget =
CALCULATE(
    SUM( Budgets[Budget] ),
    FILTER( VALUES( Budgets[Month & Year] ),
        Budgets[Month & Year] IN VALUES( Dates[Month & Year] )
    )
)
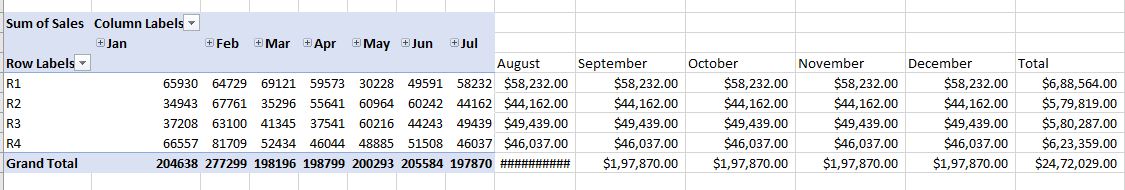
To avoid blanks in the Matrix visual and adjust the row totals, I’ve created a Display Measure that combines Total Sales and Total Budgets
Display value =
IF(
    ISINSCOPE( Budgets[Month & Year] ),
    COALESCE( [Total Sales], [Total Budget] ),
    [Total Sales] + [Total Budget]
)
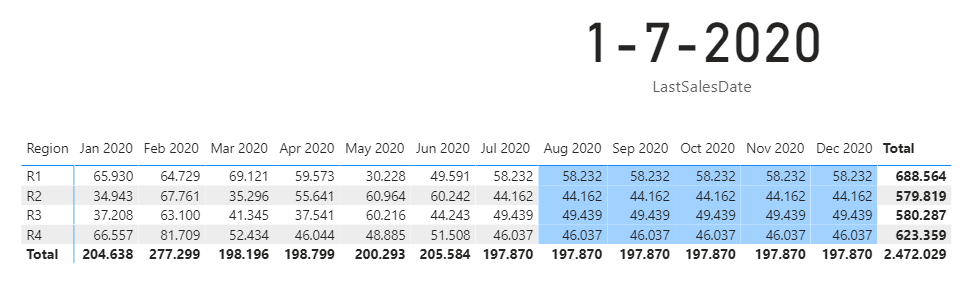
And this is what it looks like, all put together.
Added conditional formatting to easily distinguish between Sales and Budget.
Here’s the sample file.eDNA - Budget for remaining months.pbix (71.6 KB)
I hope this is helpful
1 Like
Hi @ajinkyakadam0009, did the response provided by @Melissa help you solve your query? If not, how far did you get, and what kind of help you need further? If yes, kindly mark the thread as solved. Thanks!