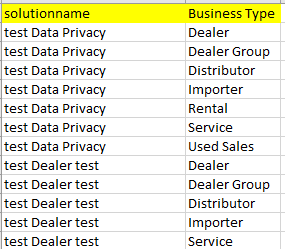
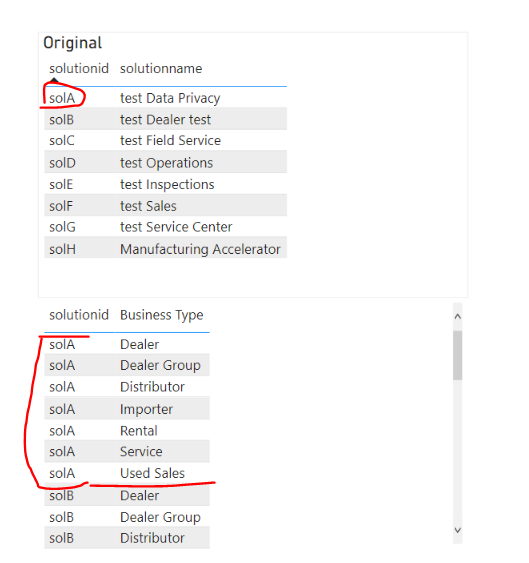
When I have list of data in table visual like this :
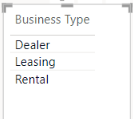
And I have another table that has the same info of “Business Type”, like this :
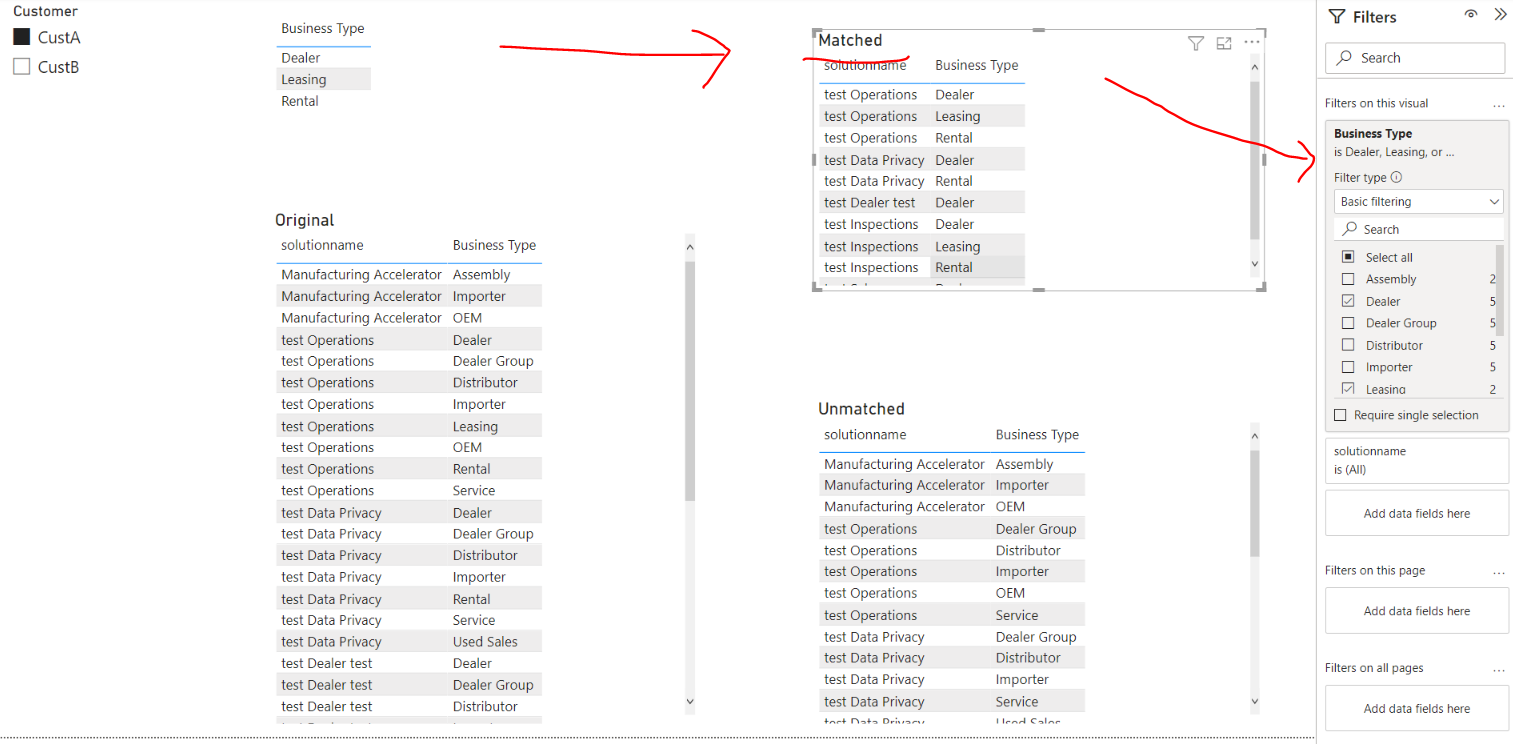
So this list actually also coming from another table that already filtered, lets call it table Customer Profile where it is filtered to 1 customer.
How to make the 1st list filtered by the 2nd list ?
Tried to google and search many resources but every time is about creating measure for its value summation, however there is no value in this table. Also I don’t want to create another table as I understand if I’m using INTERSECT, it will create new table, am I right ?
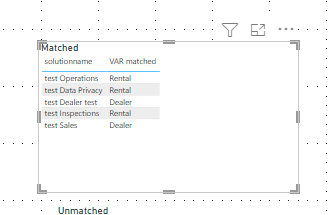
I would also later on will need the same table visual but this time list of NOT MATCHED of the 2nd list, so like an OUTER JOIN. But then again I would like to be in visual only, not create new table. Is it possible ?
You requirement is bit cloudy can you create a pbix for your situation and let us know what actual you want as output then you can get your answerer quickly.
For your starting point have you look into virtual table concept.
So there is 2 table on the right : Matched and Unmatched, currently I filtered it manually, but supposedly it is compared or lookup to the Business type in the middle.
But I hesitant to create new table for this because my report later will use Direct Query, so it is no allowed to create new table.
IF this going to be direct query then you can add flag on table and based on that you can make relation ship .Have you given this type of approach a try.
Thank you, but I’m sorry, my bad that my example is not that correct. Because it is coming from ERP system, that some table is not really de-normalize.
The Solution table is actually split into 2, with the solution id and name, then it is break down to profile per rows.
While our users and experts do as much as reasonable to help you with your inquiries, not all concerns can be attended to especially if there are some learnings to be done. Thank you!