I’m not sure which is the best approach here, I’m guessing a Switch Statement but I may be wrong also not sure if I should do it as a measure or as a calculated column. I’m guessing a measure.
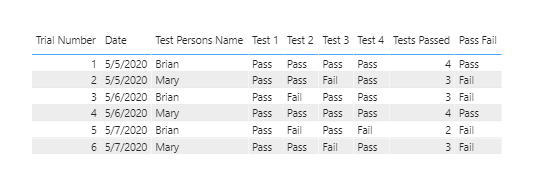
Anyway I’m doing testing at work and would like to create a little Power BI Dashboard showing how devices passed and failed. I’m able to do that already pretty well. What I would like to do now is if a device has failed in any area at all anywhere it be classified as a fail. We do a multiple set of tests up to about 30. So when I put this together it’s going to be a pretty long measure I’m guessing. I’ve put together some example data showing 4 tests not 30 with an example of the finished result I’m expecting. What I’m looking for is a measure that will fill in the last column for me “Overall Test Result”
Any fail in any test should result in a fail in the Overall Test Result Field.
You seem to want an overall result per Test person and Date. Have you considered translating this logic to Power Query? It’s hard to judge because I don’t know what’s involved considering the source data and test logic but I’m guessing that is doable.
A second idea, instead of Pass/Fail could you assign values 0 and 1 (so swap them as to what you are used to in Excel, meaning 0 = TRUE (pass) and 1 = FALSE (fail) )?
If so, you place Test person and Date on the Rows of a Matrix visual and all your Test results in the Values section, now all row totals greater than 0 = fail. Just a thought.
And writing a Switch Statement is an option as well…
Let me know if I can be of any further assistance.
I was thinking along the same lines as @Melissa. If you unpivot your data and create a simple 1/0 dummy variable in Power Query, your DAX reduces down to two short measures:
Hi @DavidNealon, Did the response provided by the experts help you solve your query? If not, how far did you get, and what kind of help you need further?