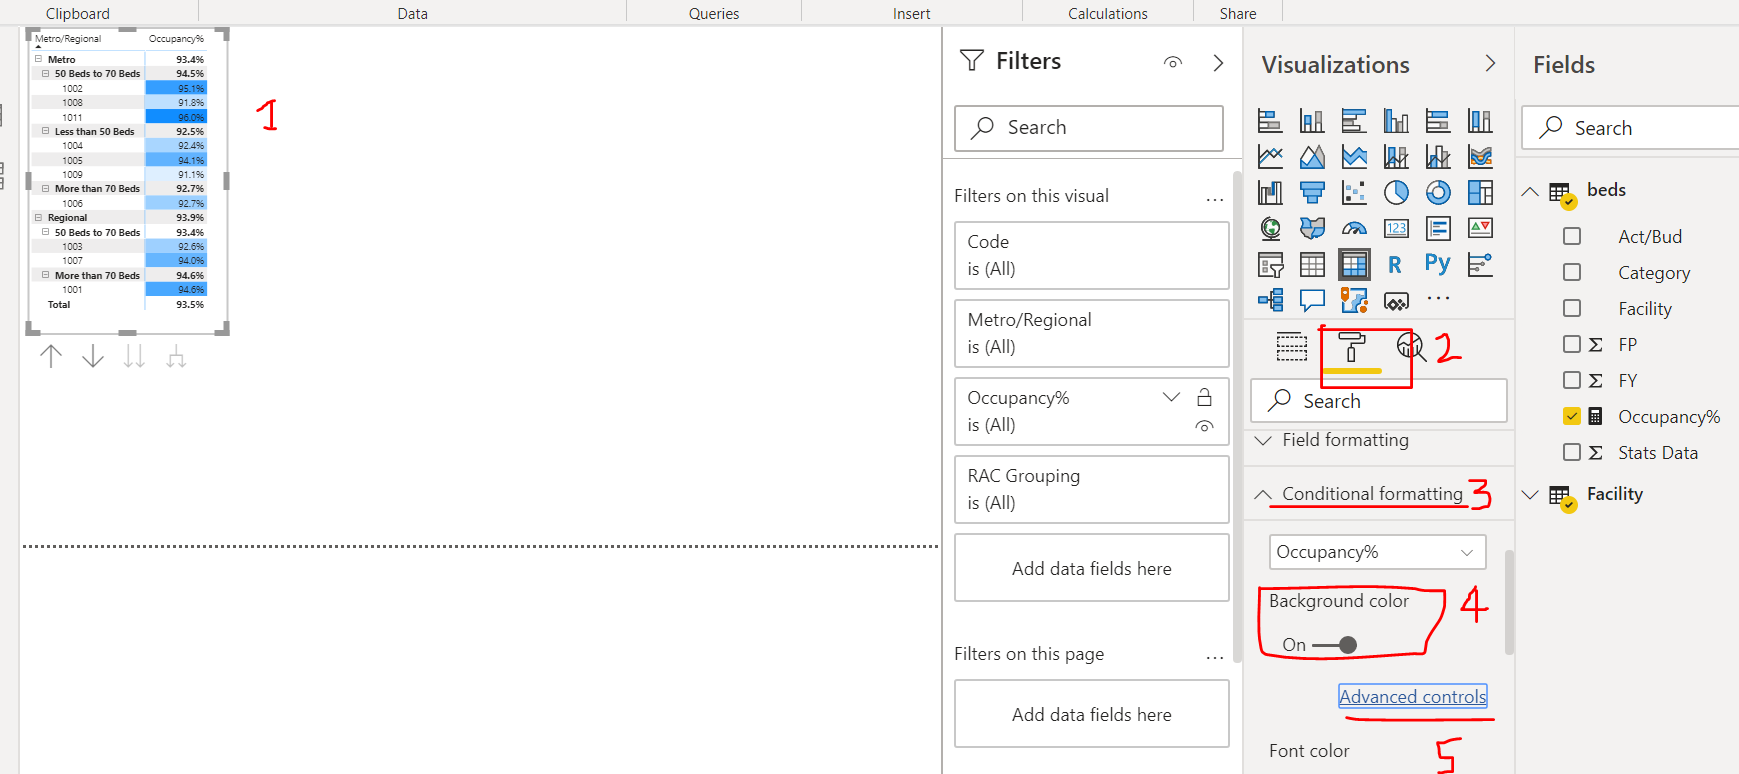
I have attached my data and my measure in Power BI. I would like to high light the occupancy which is under group sub total.
In Excel, I can do Conditional formatting by group if they are below average for the group. Is there anyway to do conditional formatting referring to group Subtotal in PowerBI.
Thanks, MK3010. Much appreciated for replying me so promptly.
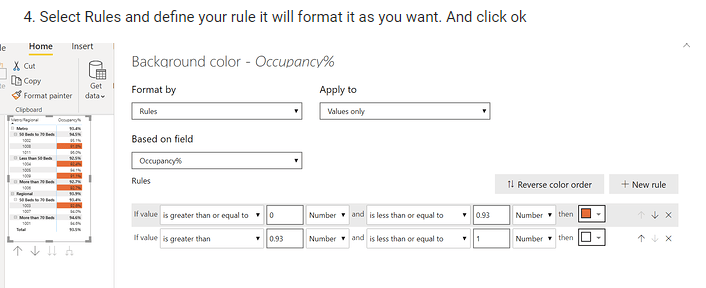
From the following step, I will not know about 93%. Average occupancy for each group will be varied.
Instead of hard coding, I will require to reference to Sub total of each group.
My conditional formatting should be based on average(sub total) of each group. If the facility total is lower than the sub total, I want it highlighted, else no highlight.
Thank you.
Hi @ammu. One way forward might be to make a new measure that calculates what group you want a row to be in (temporarily add it to the table to see if it reflects what you want). You can then use the method in @MK3010’s post to with the new measure instead of the occupancy % and set rules based on the values you set for your new measure. Hope this helps. Greg
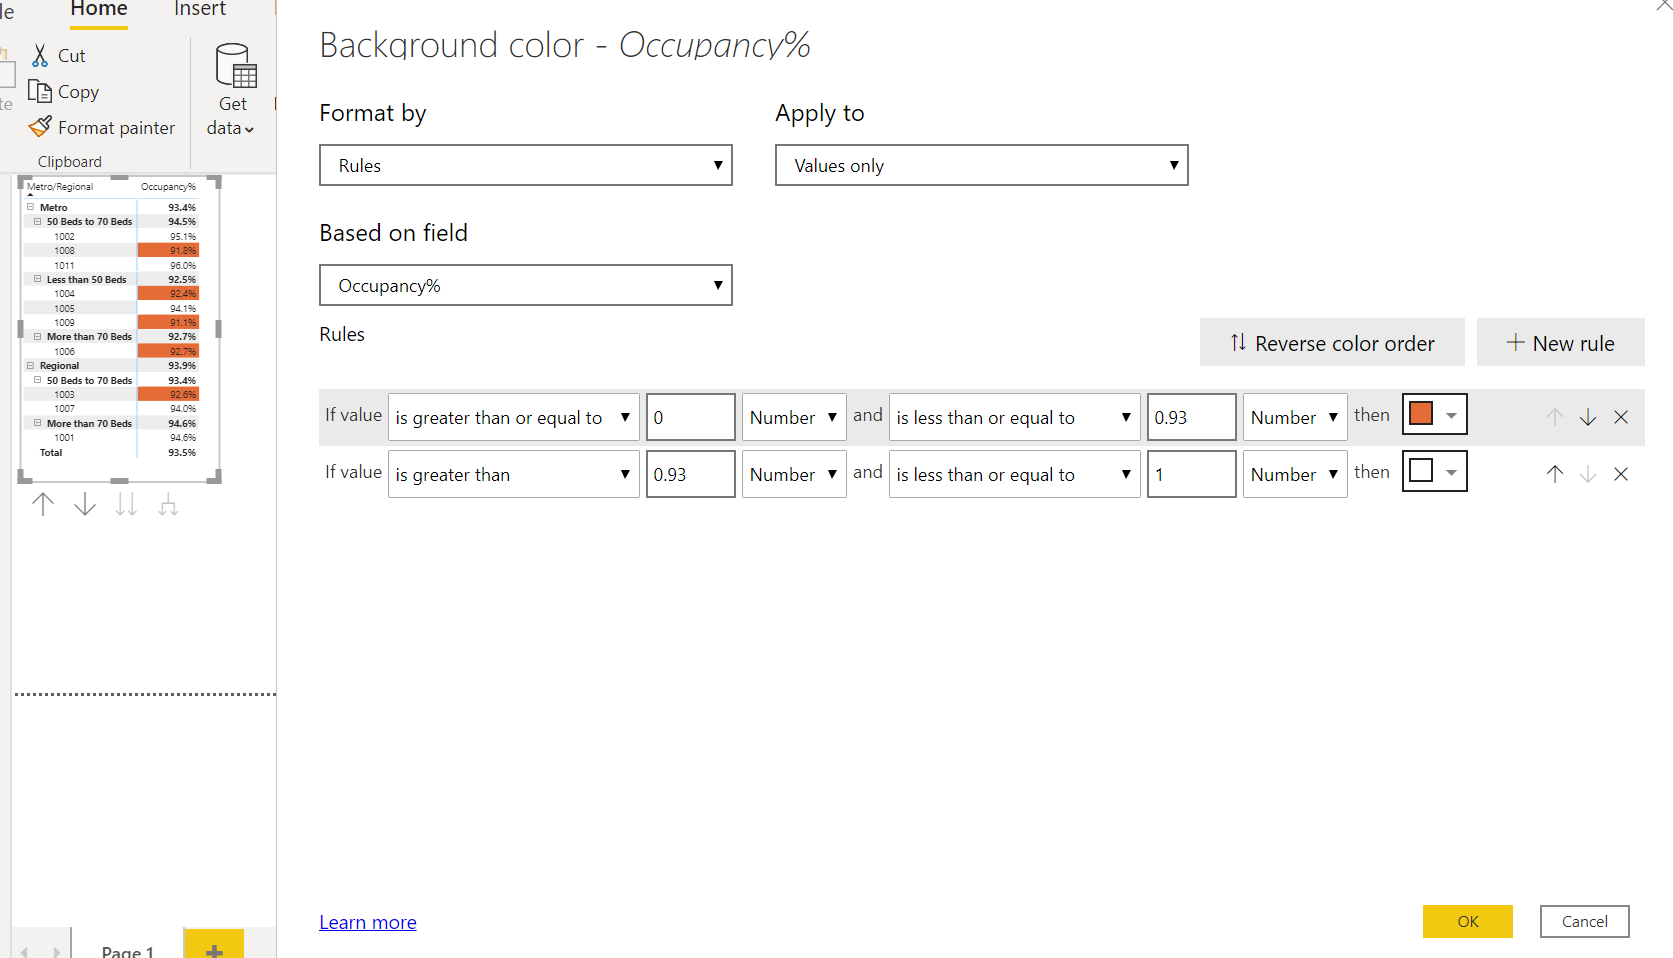
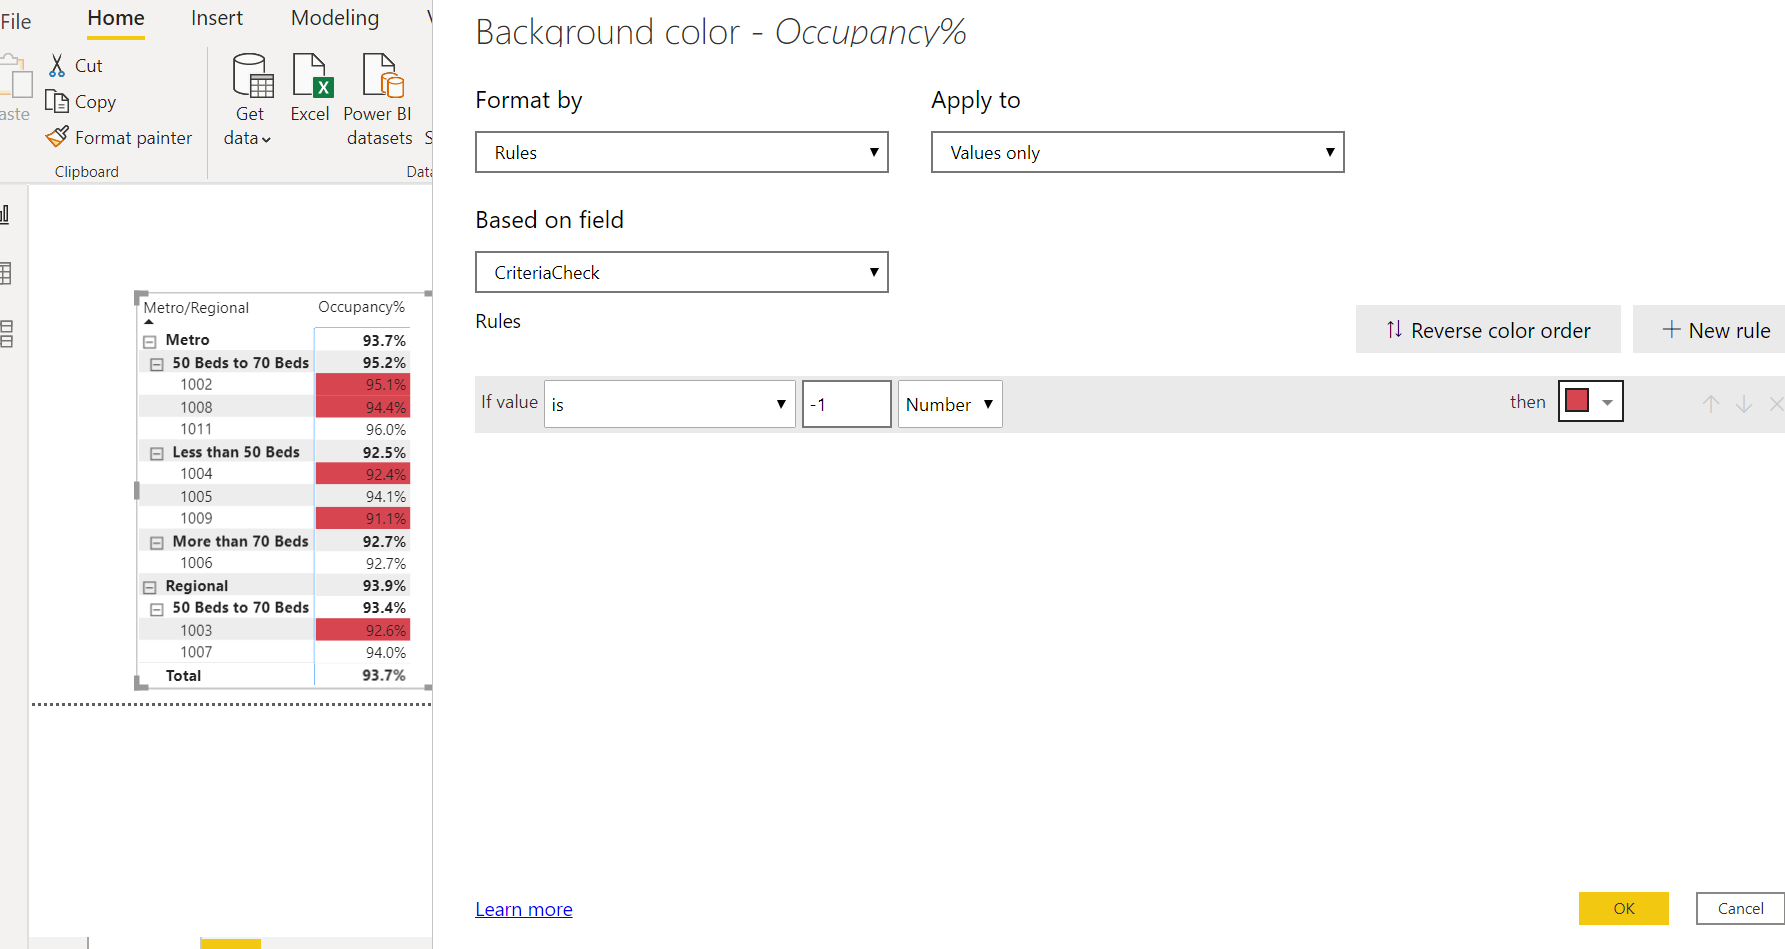
There are some smarter heads than I on the forum, but is this what you’re trying to achieve? Where it’s formatted a particular colour when it’s above the average and another when it’s below (and a final option if it’s the same as the average)?
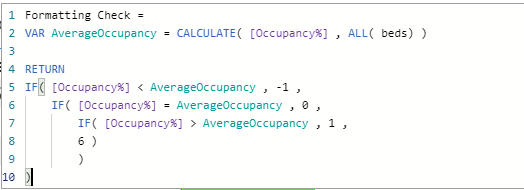
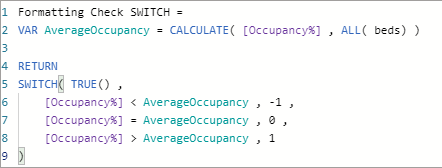
If so, I put in a separate measure that generates a value of -1 for below the average, 0 for matching the average and 1 for exceeding the average. I then set up a conditional formatting rule based on this measure.
Many thanks, Michael,
I like the SWITCH TRUE formula.
I can start using it.
What actually wanted was not based on total average, but base on Group average. I am sorry if I did not make it clear.
For group, Metro (50 Beds to 70 Beds), I would like to have cost center 1002, 1008, and 1011 based on 94.5% instead of basing on 93.5%.
For group, Metro (Less than 50 Beds), I would like to have cost center 1004, 1005, and 1009 based on 92.5% instead of basing on 93.5%.
For group, Metro (More than 70 Beds), I would like to have cost center 1006 based on 92.7%(of course it will be more in real data) instead of basing on 93.5%.
For group, Regional (50 Beds to 70 Beds), I would like to have cost center 1003, and 1007 based on 93.4% instead of basing on 93.5%.
For group, Regional (More than 70 Beds), I would like to have cost center 1001 based on 94.6%(of course it will be more in real data) instead of basing on 93.5%.