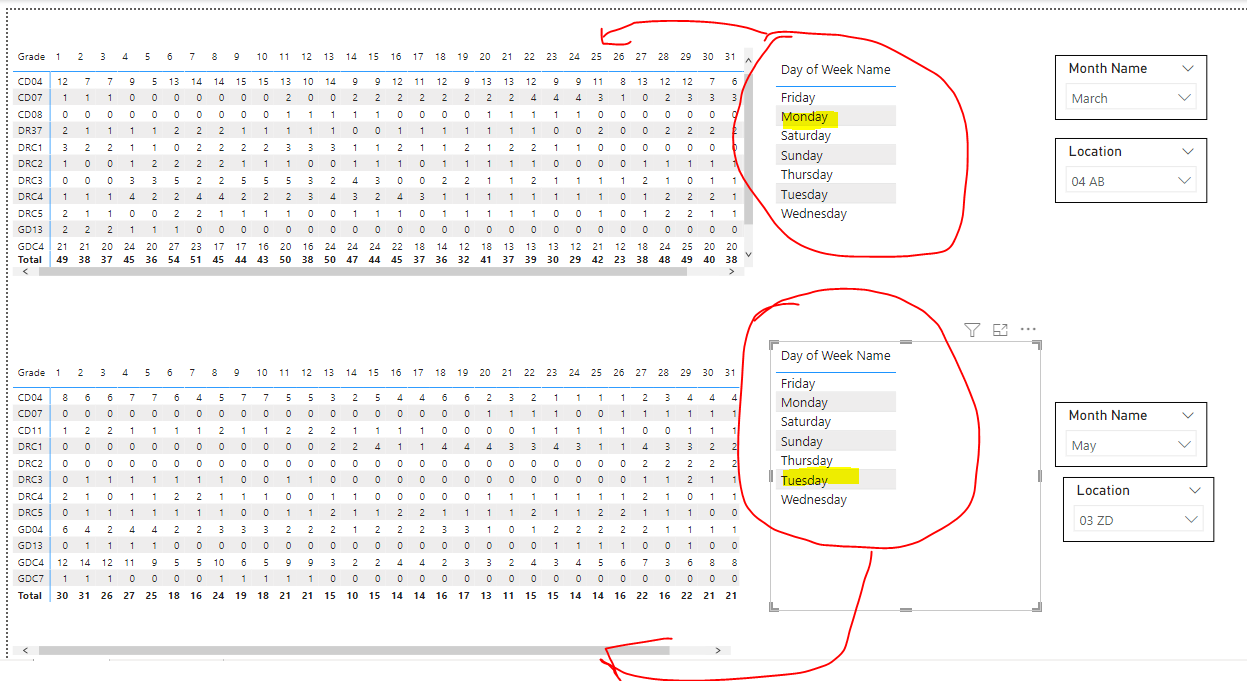
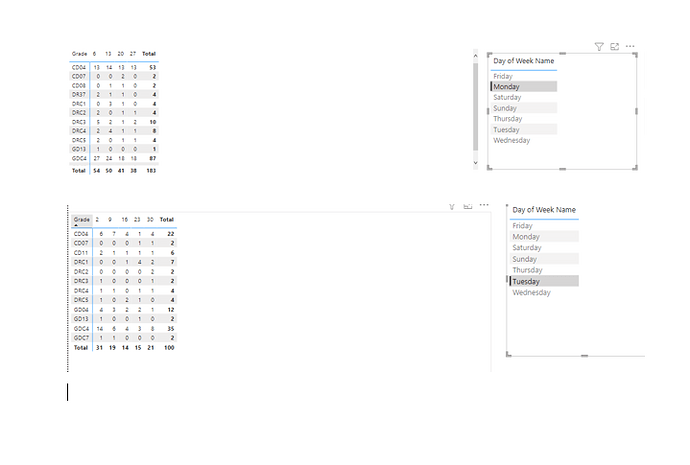
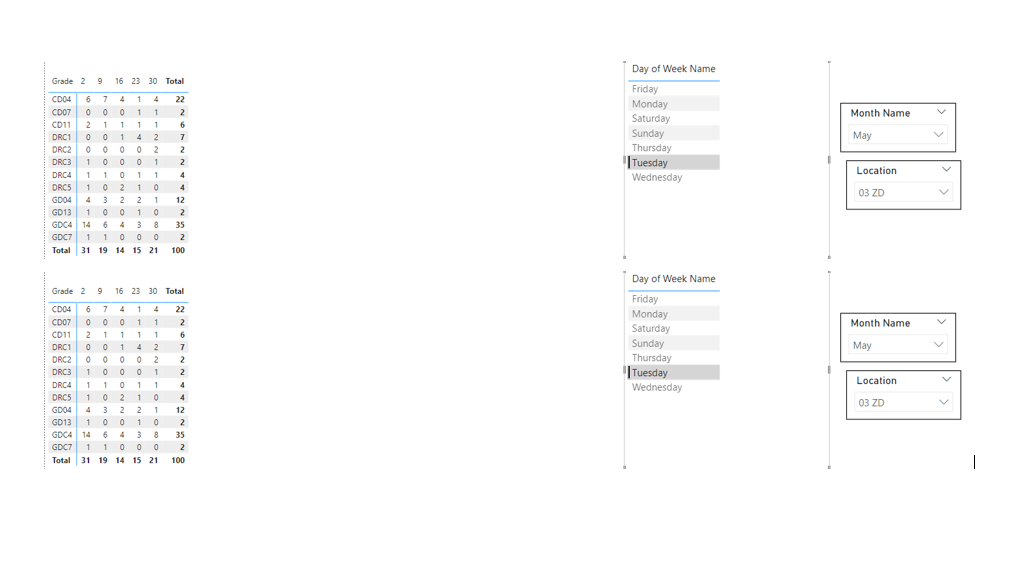
I need to disconnect these two marked on red visuals, I would select a different day on the upper one and a different day on bottom one and look at both of them at the same time.
visual interactions can be a tricky thing - and you’ll want to make sure that you leave notes for any future developers as to what you have done.
select ANY visual on the page, and go to the Format tab at the top
click the “Edit Interactions” button
you’ll need to go through each of your filters, and change the filter logic -
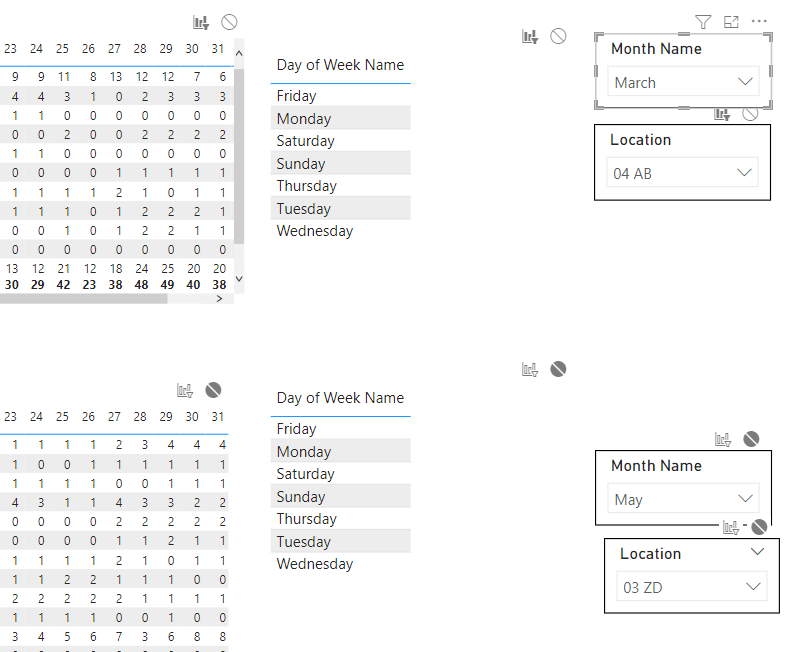
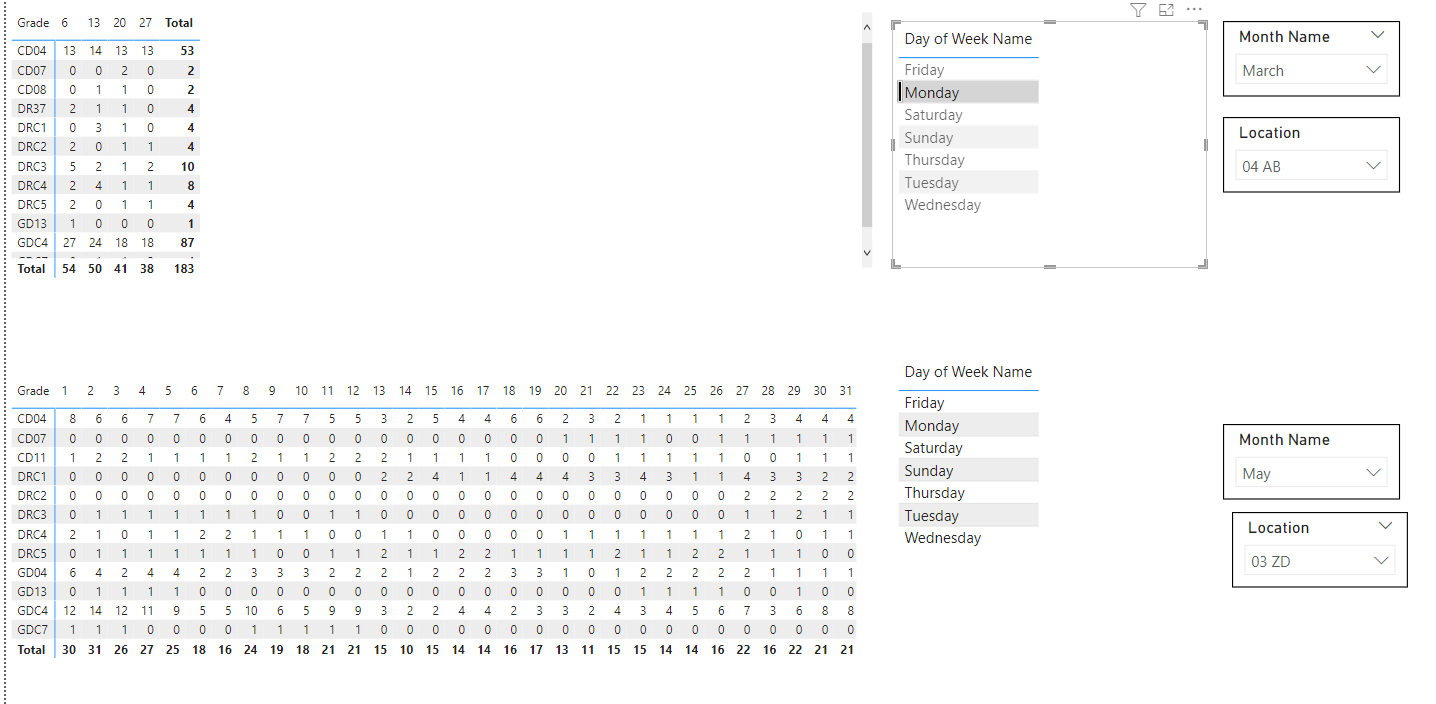
I see that this has already been done on the top “Month Name” and “Location” slicers (the top one does not filter the bottom visuals, the bottom one does not filter the top visuals):
What you have missed are the Day of Week Name tables that you are using as filters - you’ll need to set those interactions as well.
I’m running out the door at the moment, but will check back on this when I’m done with my appointments to see if you need further screenshots.
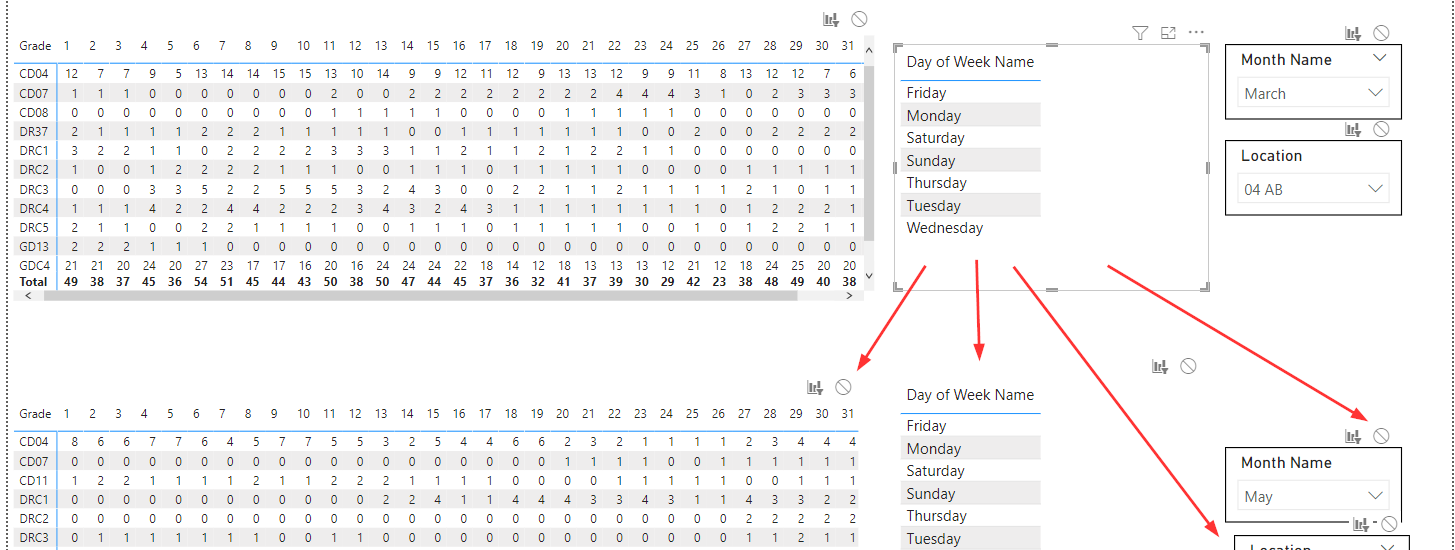
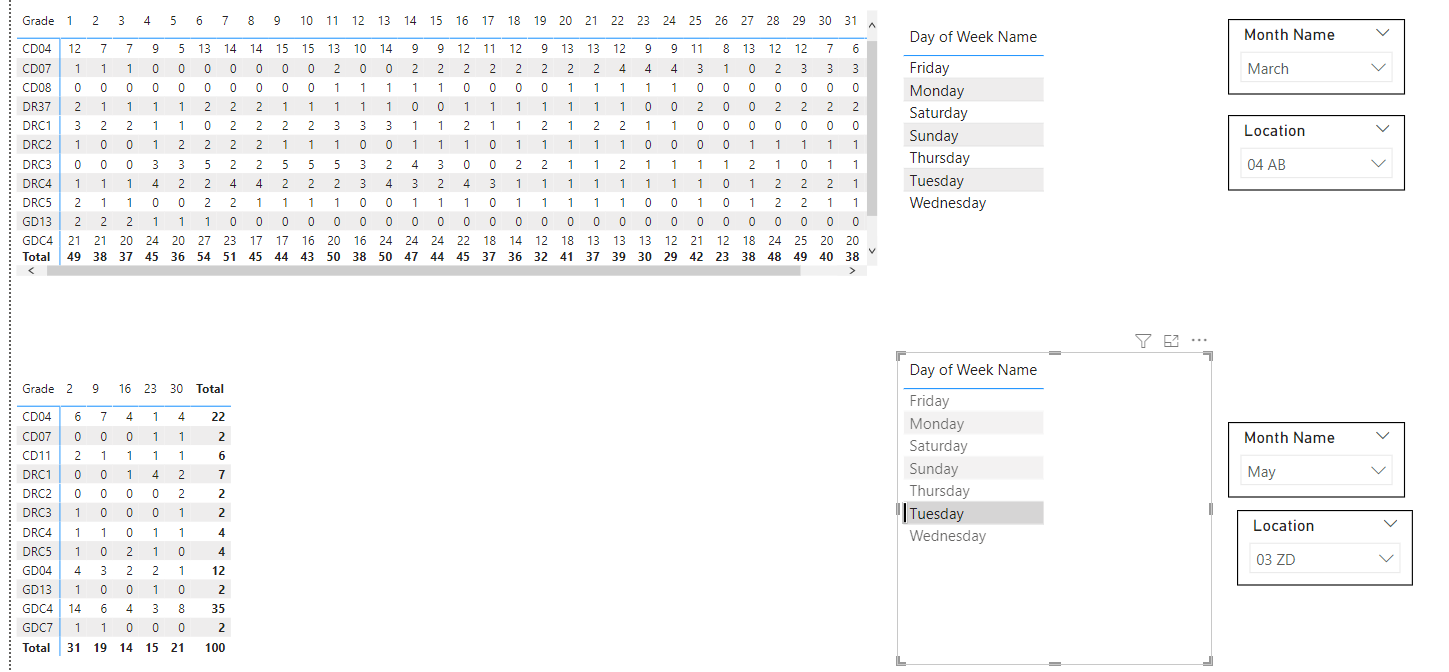
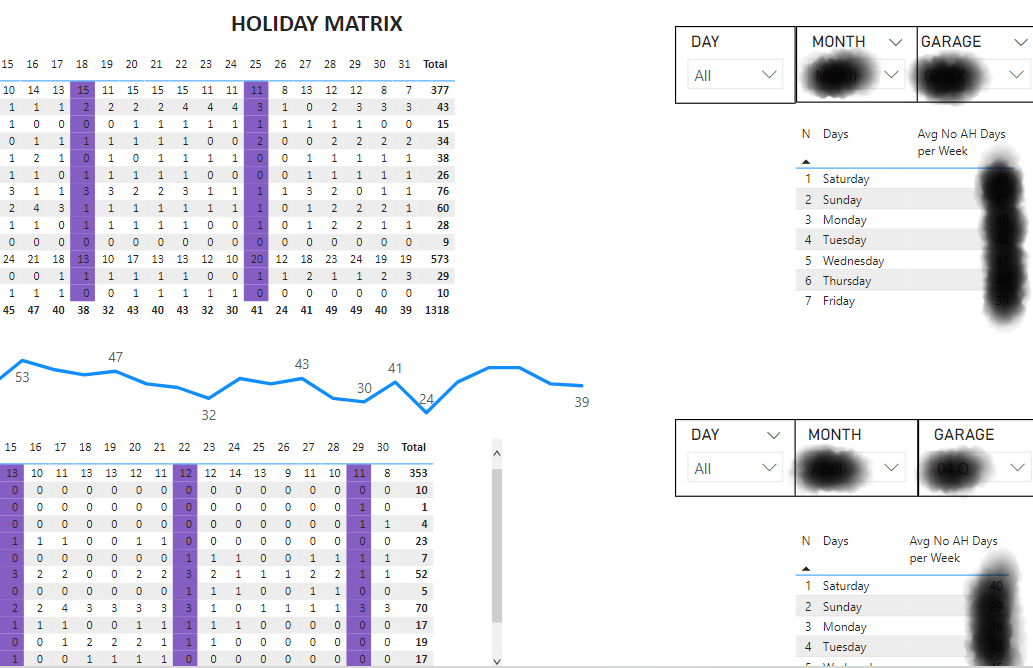
as you can see from this new screenshot - when you select the top Day of Week visual - it will filter all visuals on the table if you click on it. You need to turn off the interactions with both Day of Week Name visuals just like you did for the slicers.
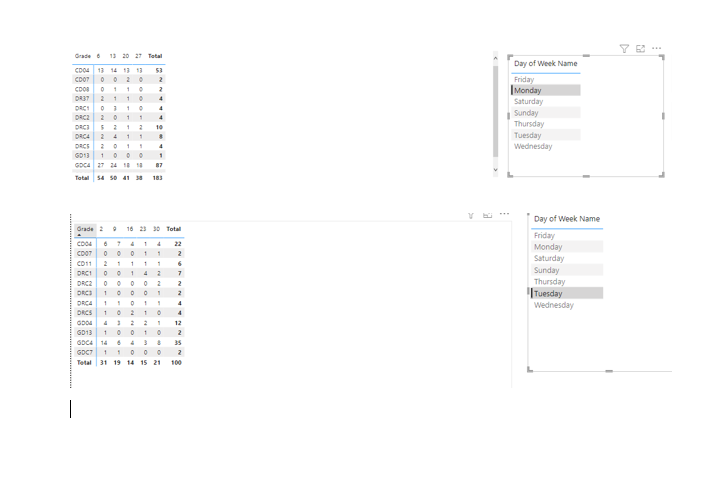
To take this a step further, I would do the same with the large Grade tables - bottom table should not filter anything at top of report, and top table should not filter anything on bottom of report.
so, you need to have the month name and location data filter both tables?
and then use the Day of week Name table to filter only the top or bottom table as they are positioned?
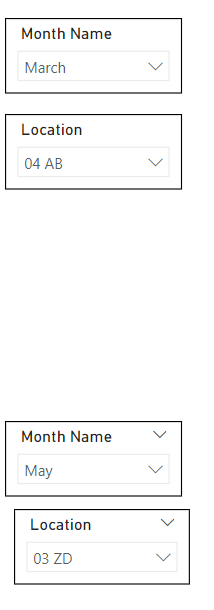
If that is the issue, just remove the extra slicers for Month Name and Location - and then re-set the filter interaction to allow those filters to interact with everything.