How to create new measure that calculates occupancy per month between two date columns?

Hello experts of Power BI,

I have a table that has three columns, one is the name of the person, one is the date they entered and the last column is the date they left. I am trying to create a new table or measure on Power BI that calculates the occupancy for each patient per month. For example, my original table looks something like this:
www.screencast.com/t/s5iugCYKqQ8n

The table or measure I am trying to create would look something like this: www.screencast.com/t/tGNGibLh145

Can someone please help me figure out how I can accomplish this? I have been researching and trying different things on Power BI to do this, but I am lost. I would highly appreciate if anybody can help me figure it out, Thank you!

Do you have a model (pbix) file that you can add here? Please do.

That would be helpful in getting a solution quickly on this.

This I don’t believe is too difficult but would like to set it up in a model so that the solution can be very relevant to what you need.

Occupancy.pbix (62.4 KB)

Please see the attached .pbox file. I am absolute Power BI noob but I feel like I am picking things up fast, but not at the level to solving this scenario yet. Thanks so much!

One thing I would recommend here first is actually attempt to give it go in the model. The best way to learn is to just start writing DAX, create models etc.

It will also speed up how we can assist you.

First you need a date table (always). Not going to get very far without one here.

What you ultimately need to solve this is derivative of the ‘events in progress’ pattern that can be found below. It’s all about managing multiple dates in your fact tables (like we have here)

Here’s what I created for this one.

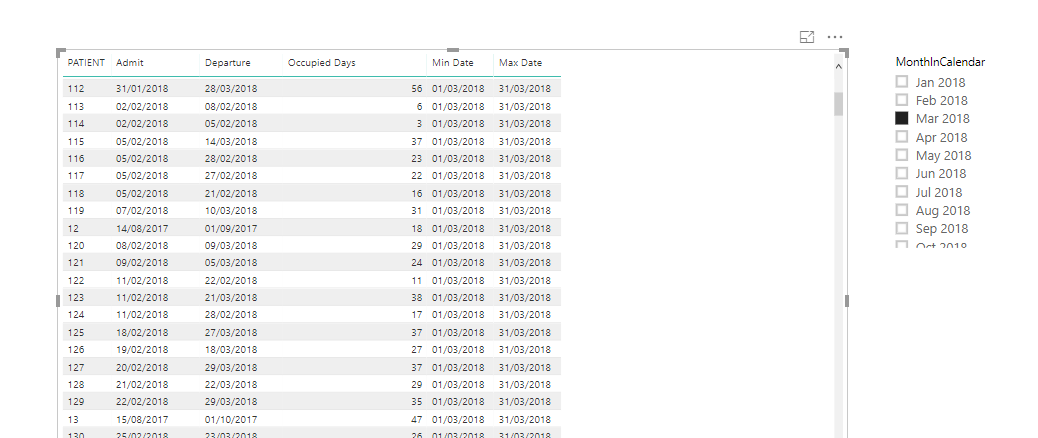
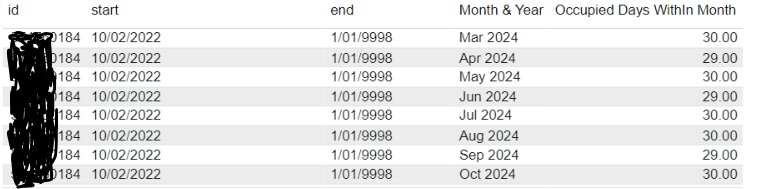
I initially just built it out, bit by bit, so I could see all the numbers in a table. I always recommend this

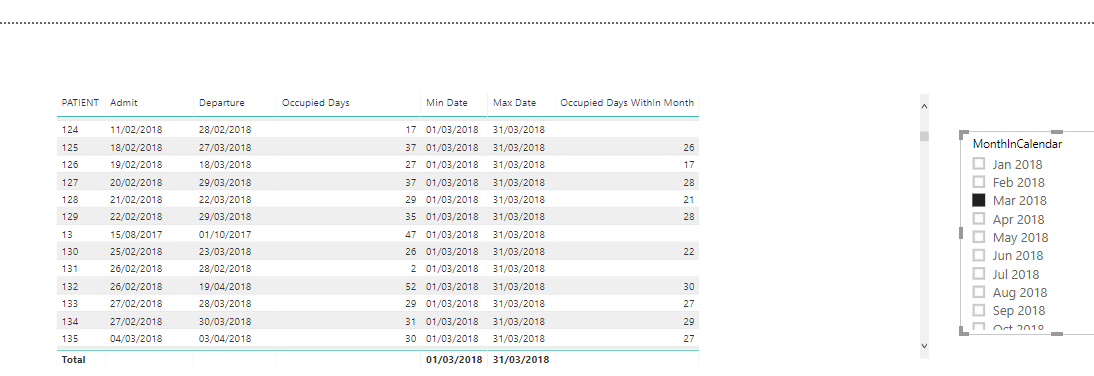
Now all that’s required is the logic to account for each within month number.

This actually took a while to work through this, but I think I have it now

Occupied Days WithIn Month = 
VAR AdmitDate = VALUE( SELECTEDVALUE( Table1[Admit] ) )
VAR DepartureDate = VALUE( SELECTEDVALUE( Table1[Departure] ) )
VAR MinDateInContext = VALUE( MIN( Dates[Date] ) )
VAR MaxDateInContext = VALUE( MAX( Dates[Date] ) )

RETURN
IF( AND( AdmitDate < MinDateInContext, DepartureDate > MinDateInContext ) ,
        MIN( DepartureDate, MaxDateInContext ) - MinDateInContext,
            IF( AND( AND( AdmitDate > MinDateInContext, AdmitDate < MaxDateInContext ), DepartureDate > MinDateInContext ),
                 MIN( DepartureDate, MaxDateInContext ) - AdmitDate, 
                    BLANK() ) )

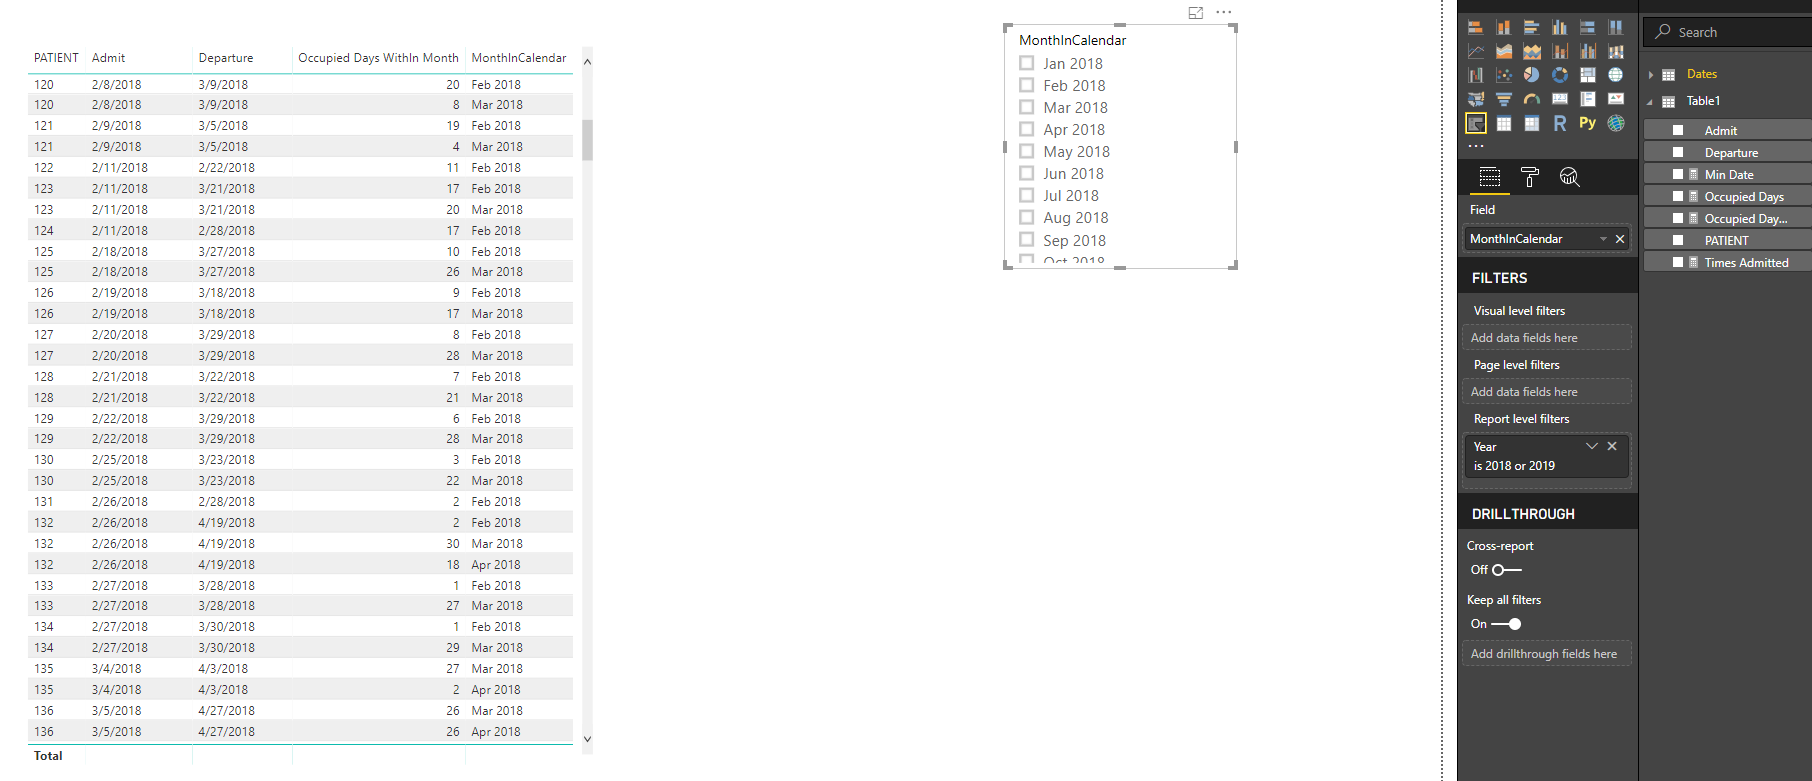
Initially I worked it out via a table.

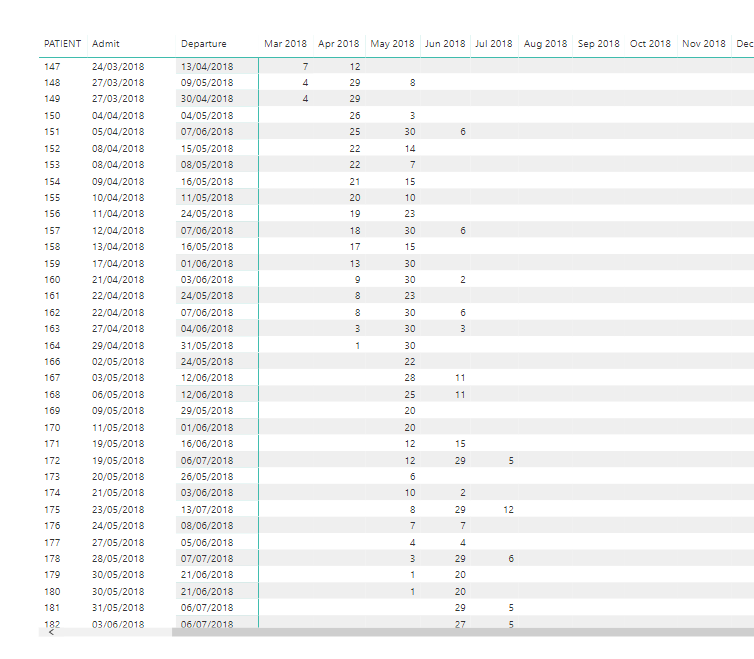
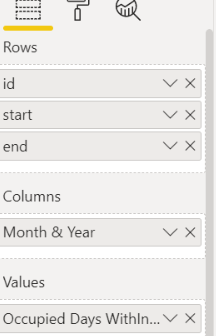
Then I placed it into a matrix which looks a bit better.

I’ve checked it a little and I think it all works. You’ll have to dig deeper.

I’ve attached the model.

Occupancy.pbix (139.7 KB)

Sam

Wow, this is incredible! I am beyond thankful, this will get me respect at the workplace! When I convert the visualization from a matrix to a table, is it still possible to do a date drill down? Do I need to create a hierarchy first to do this? Thanks so much again!

Yes you can do a date drill down here as well, you just need the date table in your model like I have in the example

Sam

Hi,

When I converted the matrix to a table, I no longer see the drill down button. Please see the screenshot here:

Do I need to write a DAX query to get the hierarchy back in the table? Thanks so much!

If you are looking for the drill down in a table then you likely need to create a hierarchy first. You can do this by dragging one column over another in the fields section.

Maybe I’m confused as to what you need here because I don’t even see a hierarchy in the example I drew up myself as the solution which was in a matrix.

Anyway I believe it’s the hierarchy that you need.

Sam

Hello there,
Any idea if you can run aggregate fuctions via this logic?
So, for example calculate the total occupancy days for all customers, for a month?
Thanks in advance
Zissis

Yes definitely,

Just with something simple like this you can get that from this example

Monthly Occupany Days = 
SUMX( 
    VALUES( Table1[PATIENT] ),
        [Occupied Days WithIn Month] )

Thanks
Sam

Works great!
Thanks for the great post and immediate response!
Cheers
Zissis

Thanks for the solution. I am not able to produce/convert to matrix view. 1st image shows table view but when I convert to matrix there is no data displayed (image 2)

-img 1

image
Thanks in advance.