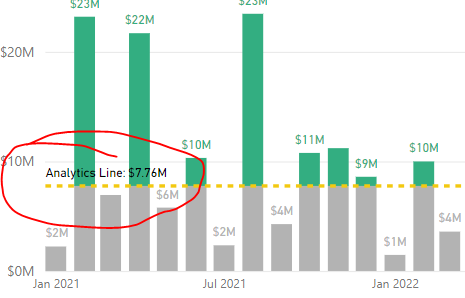
I am trying to find a way to create an average line with a label like in the picture below
The visual come from this file below and I can’t figure out how the desired staff was produced. Data+Label+Formatting.pbix (4.3 MB)
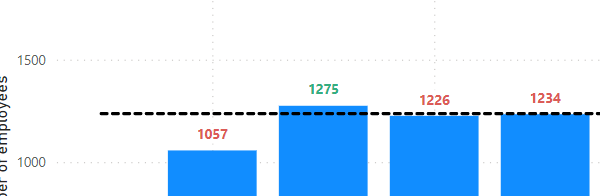
I managed to achieve something like that below but it doesn’t reflect what I primarily wanted to achieve. I am not happy with that Iwona_forum_slicers.pbix (221.4 KB)
Does anyone have any idea which steps I should take in order to get this beautiful picture?
As always highly grateful for your help and support.
Great job on setting up your line measure - that IS needed for this particular solution.
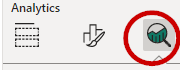
What you missed, was where to apply this - it’s on the “add further analysis” tab of the visual formatter:
if you go back to the original report, and look at this section you’ll see that Reid has applied a “Constant Line” to the visual
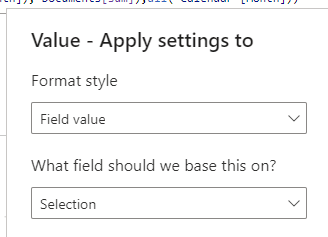
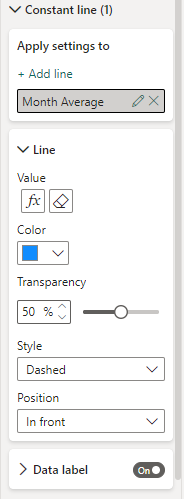
Here are the settings I applied to the constant line on your report:
Add Line, and give it a name (I used Month Average)
for the value:
you can use a static value (such as if you know it should always be 15, you can just type that in)
OR - you can use a measure, input that by clicking the fx button, and adding your measure
Turn on the data label, and set the style to “BOTH” (if you want the value and the name) as in the example