How to create a rolling stock calculation

image

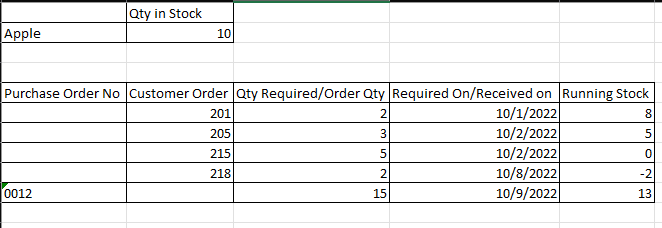
I wish to know how we can calculate Running stock column in the above table , in this example we know the current on hand stock for the apple and the demand for them as per orders that should delivered on date mentioned required & incoming delivery on a certain date, the last row in the running total column will be the free stock in Dax or power Query. I hope you can help.

Their is a solution in R mentioned below would like to if plug this into Power BI will it work in Power BI service (web)

library(tidyr)
library(dplyr)

Dummy Dataset

Data ← data.frame(
ID = c(200:205),
Order_Type = factor(c(rep(‘ordered’,5),‘received’), levels = c(‘ordered’,‘received’)),
Quantity = c(2,3,5,2,3,15),
Quantity_Start = c(10,10,10,10,10,10),
Date = as.Date(c(‘2022-01-10’,‘2022-02-10’,‘2022-02-10’,‘2022-08-10’,‘2022-08-10’,‘2022-09-10’))
)

Data %>% arrange(Date) %>% mutate(Running_Stock = ifelse(Order_Type == ‘ordered’, -Quantity, Quantity)) %>% transform(
Running_Stock = Quantity_Start + cumsum(Running_Stock))

1 Like

Hi @Unni! We noticed that your inquiry was left unsolved for quite some time now.

Looks like your inquiry was out of the experts and users’ bounds.

We strive to answer ALL inquiries in the forum. However, if you are sure that you provided all pertinent context to your concerns and read how to use the forum more effectively and still find your question unanswered, you can check out tutorials to learn this yourself as your membership also comes with relevant resources that may help you with your Power BI education.

While our users and experts do as much as reasonable to help you with your inquiries, not all concerns can be attended to especially if there are some learnings to be done. Thank you!