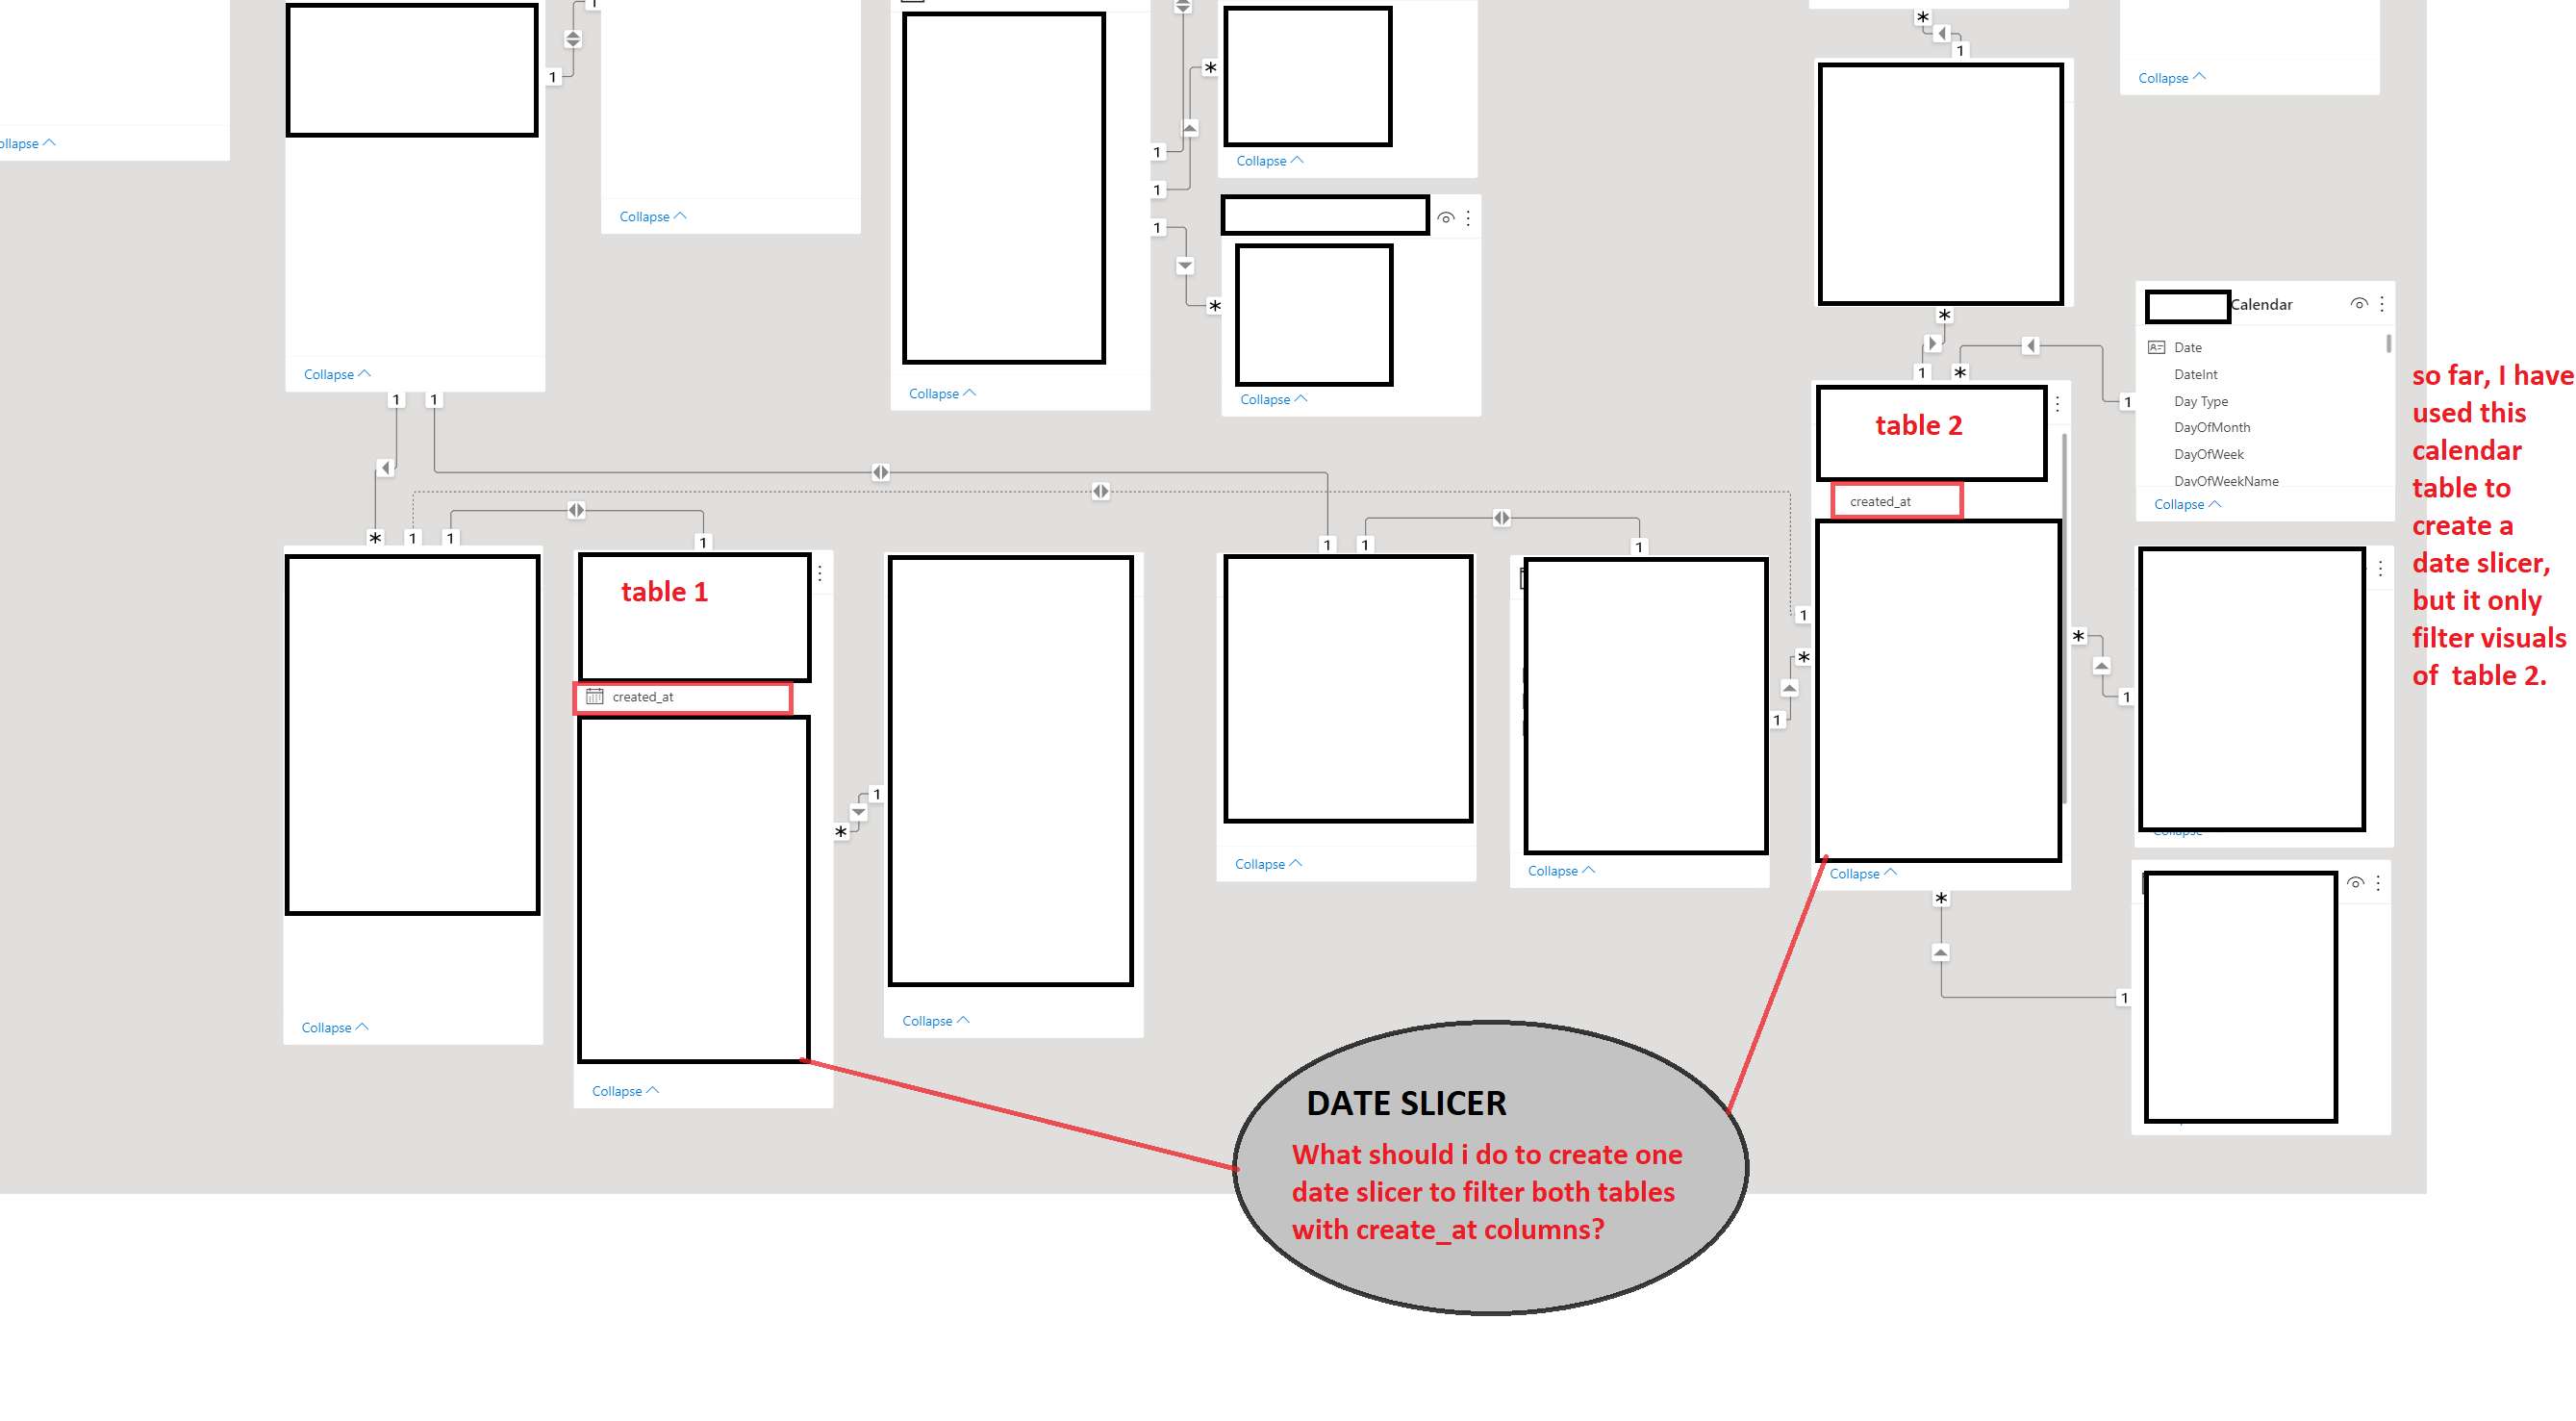
I have a complicated data model as the screenshot shows, I have several facts tables with several dates in each table. Now I am stuck in creating one date slicer to filter all visuals on one page. Including fact table 1 and fact table 2.
I have created a date slicer using a Calendar table that is connected with table 2, but when I filter the slicer, visuals related to table 1 won’t change. I have tried to connect both table 1 and table 2 ‘created_at’ to one Calendar Table, but it didn’t work either.
I would appreciate it if someone can help me out here! Thank you in advance!
IF you going to show visual with above two table in a single page then you can make a data table which covered both tables dates .
You can achieve that by just finding the min and max date from both the table and based on that create a date table .So now your date has data for both the table and it will connect easily and work as master filter table for both table.
Hi @Yusha, did the response provided by @Anurag help you solve your query? If not, how far did you get and what kind of help you need further? If yes, kindly mark as solution the answer that solved your query. Thanks!
Hi @Yusha, we’ve noticed that no response has been received from you since May 25th. We just want to check if you still need further help with this post? In case there won’t be any activity on it in the next few days, we’ll be tagging this post as Solved.
Hi @Yusha, due to inactivity, a response on this post has been tagged as “Solution”. If you have a follow question or concern related to this topic, please remove the Solution tag first by clicking the three dots beside Reply and then untick the check box.