Hello,
Can anyone here help me out in finding the DAX function to count specific text values from a column? The column contains multiple values. I tried using the COUNTA function but it totals every blank field. I hope someone could help me on this.
Hello,
Can anyone here help me out in finding the DAX function to count specific text values from a column? The column contains multiple values. I tried using the COUNTA function but it totals every blank field. I hope someone could help me on this.
Also potentially you could try using the formula below to capture the specific value:
CountValues = CALCULATE ( COUNTROWS ( TableName ); TableName[ColumnName] = " This Value " )
This is some of the easier stuff you need to get your mind around early on when working with DAX.
Definitely jump into the mastering dax course when you can as this is where all these topics are covered in depth.
Good luck
Sam
Can I ask a follow-up question? In situations where you have multiple values in the column, do you create a measure for each one? Would you approach it the same if there as a 4 text values or 104 text values?
For instance, I am looking at data over a 5 year period. I have four values that I want to look at to determine how many employees are eligible for retirement under four conditions: EARLY, OPTNL, READY IM, and INEL. I want to be able to compare how many employees fit each condition now, a year from now, and three years from now.
@talk2gwhite for 4 values you can try:
=
CALCULATE (
    COUNTROWS ( Table ),
    KEEPFILTERS (
        TREATAS ( { "EARLY", "OPTNL", "READY IM", "INEL" }, Table[ColumnName] )
    ),
    DATEADD ( Dates[Date], 1, YEAR )
)
or
=
CALCULATE (
    COUNTROWS ( Table ),
    KEEPFILTERS ( Table[ColumnName] IN { "EARLY", "OPTNL", "READY IM", "INEL" } ),
    DATEADD ( Dates[Date], 1, YEAR )
)
Not sure from where the 104 values would come, if they are part of the dimension then just use this:
=
CALCULATE ( COUNTROWS ( Table ), ALL ( Table[ColumnNameWith104Values] ) )
Having the PBIX file would give more clarity.
Thanks for that. I don’t have 104 values. I was trying to better understand the thought process around problems like this. For instance, there may be a way that works for 4 values, while not so efficient for 104 values. I want to be sure that I am thinking about these things correctly.
I’ve attached the pbix file and the Excel file.Data Exercise 2.pbix (415.1 KB) Retirement Sample File.xlsx (1.3 MB)
Hi @talk2gwhite,
Time for some modeling… If you haven’t worked through this course yet - put it high on your list
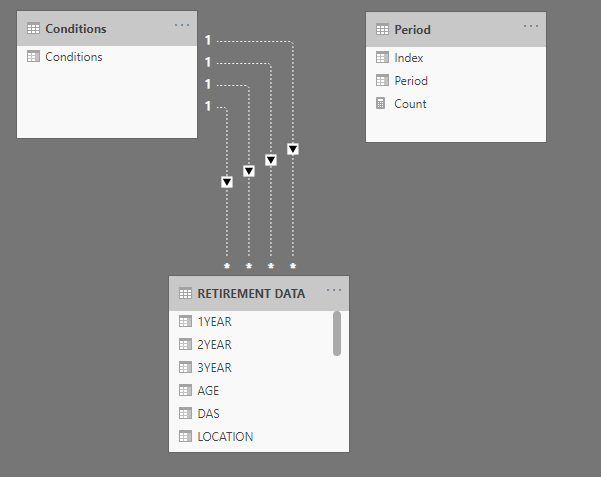
I’ve created a simple dimension (conditions) and supporting (period) table.

Next created this measure.
Count =
VAR _Period = SELECTEDVALUE( Period[Period] )
RETURN

SWITCH( TRUE(),
    _Period = "Now", CALCULATE( COUNTROWS( 'RETIREMENT DATA' ), USERELATIONSHIP( Conditions[Conditions], 'RETIREMENT DATA'[NOW] ), 'RETIREMENT DATA'[NOW] <> BLANK() ),
    _Period = "1 Year", CALCULATE( COUNTROWS( 'RETIREMENT DATA' ), USERELATIONSHIP( Conditions[Conditions], 'RETIREMENT DATA'[1YEAR] ), 'RETIREMENT DATA'[1YEAR] <> BLANK() ),
    _Period = "2 Year", CALCULATE( COUNTROWS( 'RETIREMENT DATA' ), USERELATIONSHIP( Conditions[Conditions], 'RETIREMENT DATA'[2YEAR] ), 'RETIREMENT DATA'[2YEAR] <> BLANK() ),
    _Period = "3 Year", CALCULATE( COUNTROWS( 'RETIREMENT DATA' ), USERELATIONSHIP( Conditions[Conditions], 'RETIREMENT DATA'[3YEAR] ), 'RETIREMENT DATA'[3YEAR] <> BLANK() ),
    BLANK()
)
.
Placed Periods on the Axis and Conditions in the Legend and the Count measure in the values section with this result.
Here’s your sample file. Data Exercise 2.pbix (404.5 KB)
I hope this is helpful.
Thank you! I knew that I needed to make a connection, but I wasn’t sure of how to do that. Thank you for recommending that course. I was trying to figure out what course I needed next. Searching for “modeling” gives me too many options as a novice.
I’m curious about something. None of the connections were active. If I am understanding the DAX formula, the USERELATIONSHIP function creates the connection. I don’t get why. Will the course help unpack this? If not, do you mind recommending a video/course?
Hi @talk2gwhite,
Two things to think about before trying to get a better understanding of DAX…
Therefore I always suggest to start with Advanced Data Transformations & Modeling as soon as possible. Getting your head around that quickly will save you a lot of time in the end.
It won’t be a wild guess to assume you have an extensive Excel background, right? Then start by forgetting all you know and all you think you know because DAX expressions might have the same name but operate differently then you are used to in Excel. Just think about it, you can only reference Tables and Table[Columns] in DAX expressions, not individual cells.
What Power BI and Excel do have in common however is that there are always many different ways to solve a problem or calculate a result. This was already beautifully illustrated by @AntrikshSharma who provided you several options to calculate the same thing BUT the end result will always depend on your datamodel…
When you’ve finished the Modeling course I would suggest to move on to
There is also an aid available, called the Learning Map to help you navigate through the extensive learning content provided by eDNA.
And although it can be daunting and intimidating at first, the fast track to mastering Power BI is participating in the eDNA Challenges. There is so much idea-, technique-, knowledge sharing, collaboration, encouragement and feedback going on - you will pick up something valuable every time, I guarantee. And that will benefit you in your learning and day to day tasks.
I hope this is helpful.