Hi,
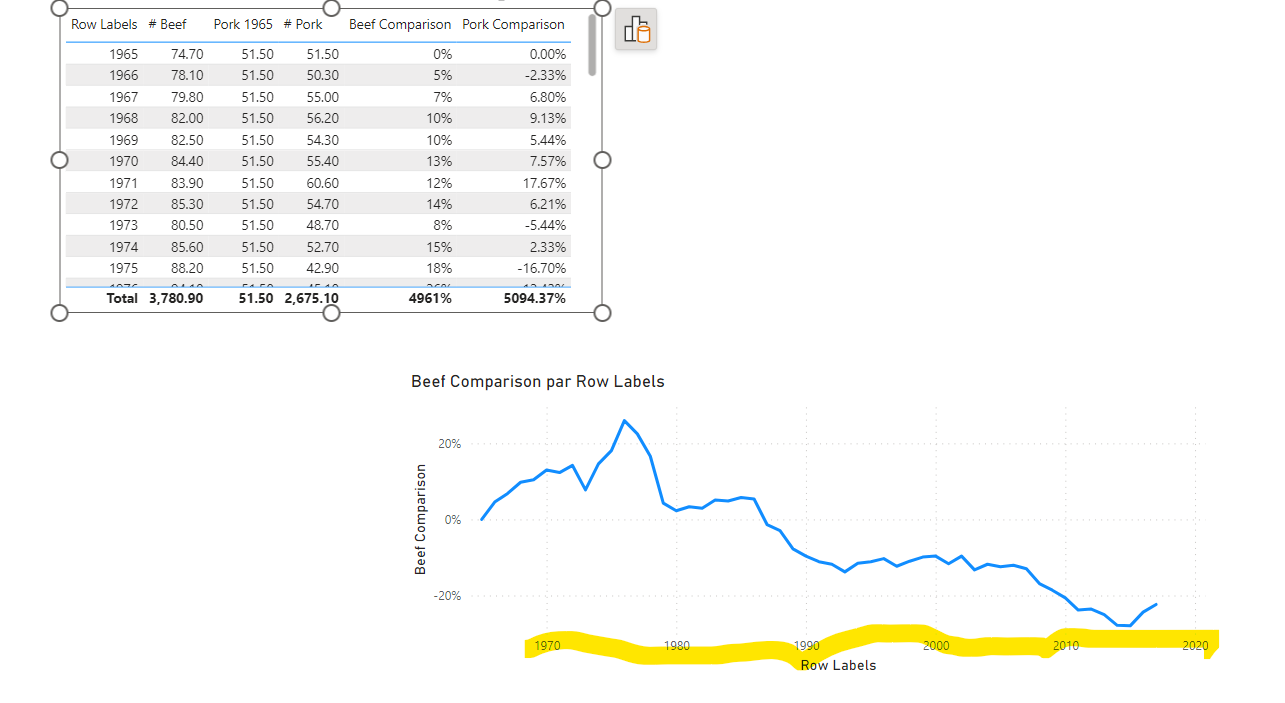
I would like to modify the increments of the x-axis for the years. I want the years to be in increments of 5 instead of 10. Could you please help me?
Thanks
Hi @Remi10
i asked Bing Chat and this is what i got.
To modify the increments of the x-axis for the years in Power BI, you can follow these steps:
- Right-click the chart axis that you want to change, and then select Axis Properties1.
- In the Horizontal Axis Properties dialog box > Axis Options tab, set Interval to Auto1.
- The chart will display the optimal number of category labels that can fit along the axis1.
- Select OK1.
Alternatively, you can customize your X-axis by selecting the appropriate fields from the Fields pane1. Another option is to make the chart wider or change the type of the x-axis from continuous to categorical1.
Please note that if you’re trying to change your increments to a specific number (like 5), Power BI currently does not have a tick interval option2. However, you can vote for this feature or log a new one on the Power BI ideas page2.
Maybe others have a solution like deneb. I know November updates has changed alot concerning visuals. You might want check to see if you have the updated version.
I hope this helps
Keith
Hi,
Thank you very much for your responses, I will try your suggestions.
Have a good day.
Remi