Hello~
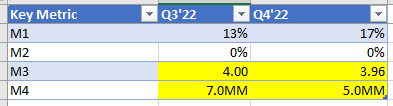
I want to import the table below into Power BI and display it as is. I want the values in the M1 and M2 metrics to show as percentages, while the values in the M3 and M4 metrics should be shown as decimal numbers. I noticed that data types can be altered by column easily in power bi table rather than by row. If you possess a solution for this scenario, I would greatly appreciate it if you could share it. Thank you very much!
see ms-doc on dynamic format strings
This is do-able, of course, but not in the way you are imagining only because I think you’re not harnessing the power of power bi. just imho.
I can help, but can you clarify what you mean when you say,
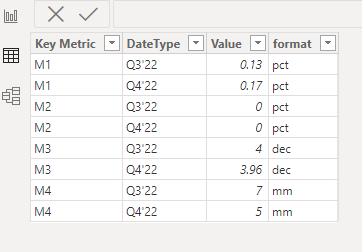
Are you saying that the example table you provide is the source and all you want to do is replicate the table in power bi rather than excel? importing “as is” is simple (i dont think there is an alternative  ). but what you’ll likely want to do is transform those data (pivoting, unpivoting, etc.). maybe restructure like this:
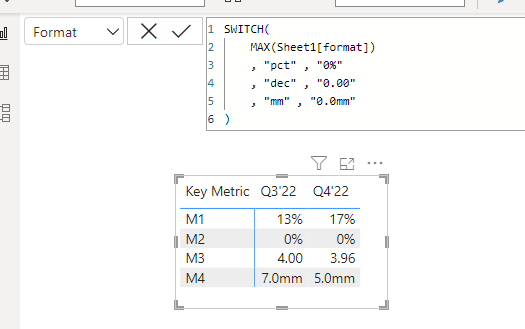
then use dynamic formatting to adjust the format depending on the value of Sheet1[Format]:
SWITCH(
    MAX(Sheet1[format])
    , "pct" , "0%"
    , "dec" , "0.00"
    , "mm" , "0.0mm"
)
that would replicate your excel table:
3 Likes
Thank you so much! It really helps!