How to Calculate Min/Max values and return values

Hi

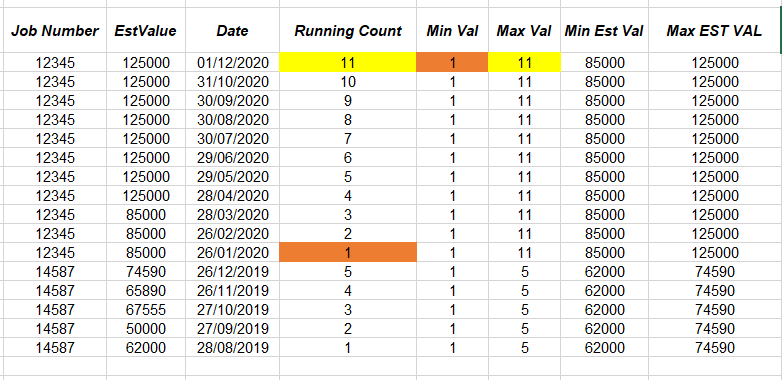
I have a list of data that is appended each month with the latest information/ snapshot provided.

What i am trying to achieve is the ability to :

  1. Identify the Min Value and repeat that value on all rows for that Job Number
  2. Identify the Max Value and repeat that value on all rows for that Job Number
  3. Using the above identify the MIN & Max EstValue and repeat on all rows For that Job Number

See example Mock up below


Testing Doc.pbix (213.1 KB)

Hope this makes sense - and any help is greatly appreaciated

Thanks

1 Like

Hi @martynross85

Try this
Testing Doc.pbix (214.7 KB)

My Min Est Value differs from yours for 14587 as that seems it should be 50000.

Created 4 measures:

Min Val =
CALCULATE(
MIN( ā€˜Job Detailā€™[Running Count] ),
ALLEXCEPT( ā€˜Job Detailā€™, ā€˜Job Detailā€™[Job Number] ) )

Max Val =
CALCULATE(
MAX( ā€˜Job Detailā€™[Running Count] ),
ALLEXCEPT( ā€˜Job Detailā€™, ā€˜Job Detailā€™[Job Number] ) )

Min Est Val =
CALCULATE(
MIN( ā€˜Job Detailā€™[EstValue] ),
ALLEXCEPT( ā€˜Job Detailā€™, ā€˜Job Detailā€™[Job Number] ) )

Max Est Val =
CALCULATE(
MAX( ā€˜Job Detailā€™[EstValue] ),
ALLEXCEPT( ā€˜Job Detailā€™, ā€˜Job Detailā€™[Job Number] ) )

1 Like

Hi @martynross85,

Alternatively you could handle this in PQ
Paste this M code into a new blank query.

let
    Source = Table.FromRows(Json.Document(Binary.Decompress(Binary.FromText("hdBLDsUgCAXQvThuwgVFcC1N97+N2k9aX5/REYQTQrjrGlhi0rDUqgBqAyYWEgjCtnQ8VsfIQSgT94nbwKUQ8sR15E5I/+4NxwFnQiedlrnhpG51bEnLzWe2XH44qz/MHTbV44jYlfyHj9O4+Az+uy3vY37ztgM=", BinaryEncoding.Base64), Compression.Deflate)), let _t = ((type nullable text) meta [Serialized.Text = true]) in type table [#"Job Number" = _t, EstValue = _t, Date = _t]),
    #"Changed Type" = Table.TransformColumnTypes(Source,{{"Job Number", Int64.Type}, {"EstValue", Int64.Type}, {"Date", type date}}),
    #"Grouped Rows" = Table.Group(#"Changed Type", {"Job Number"}, 
        {{"AllRows", each
            let 
                AscendingSort = Table.Sort(_,{{"Date", Order.Ascending}}),
                Buffer = Table.Buffer(AscendingSort),
                AddIndex = Table.AddIndexColumn(Buffer, "Index", 1, 1, Int64.Type),
                MaxEst = Table.AddColumn(AddIndex, "Min Est Val", each AddIndex[EstValue]{0}?),
                MinEst = Table.AddColumn(MaxEst, "Max Est Val", each List.Reverse(AddIndex[EstValue]){0}?)
            in
                MinEst, type table [Job Number=nullable number, EstValue=nullable number, Date=nullable date, Index = number, Min Est Val = nullable number, Max Est Val = nullable number]}, 
                {"MaxVal", each Table.RowCount(_), Int64.Type}, {"MinVal", each 1, Int64.Type}}),
    #"Expanded AllRows" = Table.ExpandTableColumn(#"Grouped Rows", "AllRows", {"EstValue", "Date", "Index", "Min Est Val", "Max Est Val"}, {"EstValue", "Date", "Running Count", "Min Est Val", "Max Est Val"})
in
    #"Expanded AllRows"

Note that the Running Count, MinVal and MaxVal columns are not required to determine the ā€œMin Est Valā€ and ā€œMax Est Valā€

I hope this is helpful

1 Like

Hi @jamie.bryan

Thanks for looking into this - greatly appreciated.

So yeah - the min EstValue would be 5000 as thats the lowest value - however what im looking to achieve is to find the lowest Runnining Count i.e. (1) and then return that Est Value.

Basically im trying to find the first instance that job number appeared and then return that Est Value an then find the last/latest instance using the running count and return that value.

This way we can easily see the range in value and how that changes Month on Month until the Jobs are complete

1 Like

Ah apologies I misread that bit. These 2 seem to work for that:

Min Est Val v2 =
VAR _MinRunningCount = [Min Val]

RETURN
CALCULATE( MIN( ā€˜Job Detailā€™[EstValue] ),
ALLEXCEPT( ā€˜Job Detailā€™, ā€˜Job Detailā€™[Job Number] ),
ā€˜Job Detailā€™[Running Count] = _MinRunningCount )

Max Est Val v2 =
VAR _MaxRunningCount = [Max Val]

RETURN
CALCULATE( MAX( ā€˜Job Detailā€™[EstValue] ),
ALLEXCEPT( ā€˜Job Detailā€™, ā€˜Job Detailā€™[Job Number] ),
ā€˜Job Detailā€™[Running Count] = _MaxRunningCount )

1 Like

Hi @Melissa

Thanks for looking into this - so this appears to work and returns the Lowest & Highest Figures on each row level.

However iā€™m not sure how i would integrate this into an existing report without making a complete mess of the existing report :grimacing:

1 Like

Thanks @jamie.bryan

Thatā€™s worked out Brilliantly - much appreciated

Thanks @Melissa for your support also - much appreciated

1 Like