Hi Everyone,
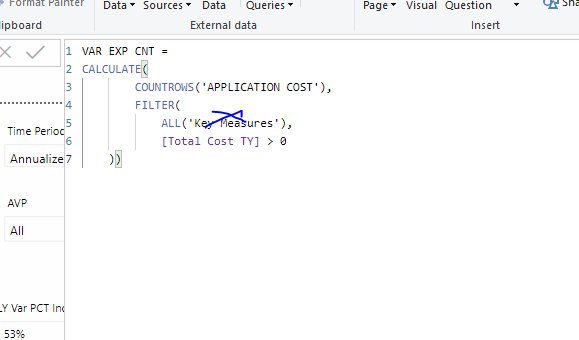
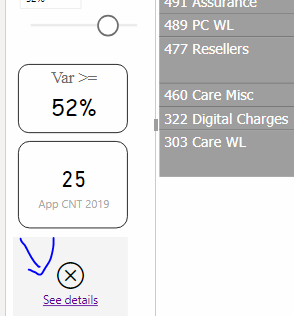
I asked this question before but found a workaround. However, I would like to revisit this scenario in which I need to count rows returned to report that met or exceeded a “What if” threshold variance that I can change using a slider. Below is copy of the DAX which I would like to use but cannot filter on a Measure [Total Cost TY] > 0. I populate this measure with a value for items that met or exceeded the threshold variance, otherwise it is set to blank. I have attached a demo model with the error I’m getting, page name is “Var PCT Increase (Cost Type).” The result I expect is 10, which is the number of rows returned with variance >= 53% increase in cost TY vs LY. Could you please take a look and let me know of any options to fix this error?
VAR EXP CNT =
CALCULATE(
        COUNTROWS('APPLICATION COST'),
        FILTER(
            ALL('Key Measures'),
            [Total Cost TY] > 0
    ))
The workaround is under page “Var PCT Increase (TOT Cost)” where I added a new column to the report called “Var APP CNT” and turned on subtotals to get my application count number.
Thanks,
Brian
Ok you’re not far off, but just have to realize that you can’t do this here

You need to work through actual tables not measure tables that have nothing in them from a data perspective.
Here’s how I would do it.
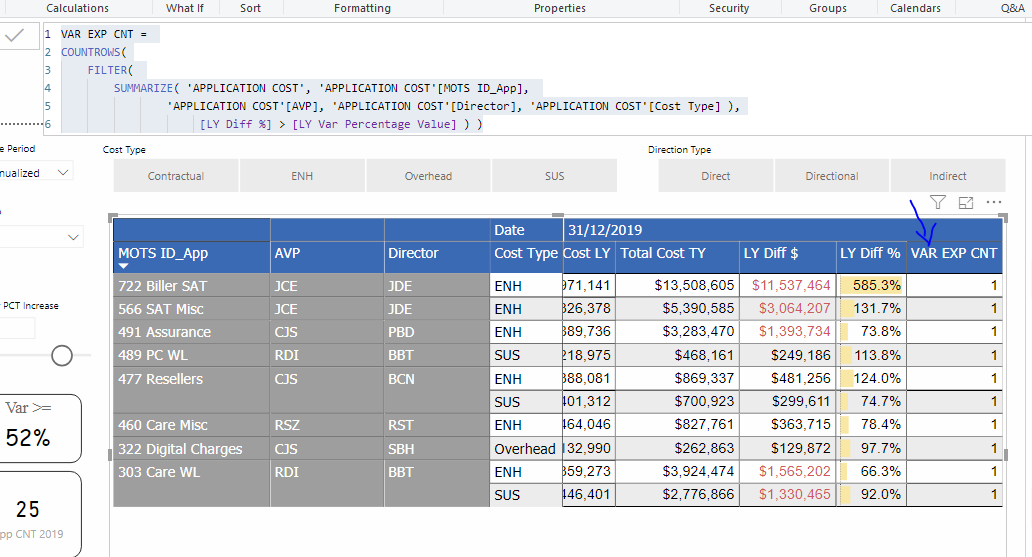
VAR EXP CNT =
COUNTROWS(
    FILTER(
        SUMMARIZE( 'APPLICATION COST', 'APPLICATION COST'[MOTS ID_App],
                'APPLICATION COST'[AVP], 'APPLICATION COST'[Director], 'APPLICATION COST'[Cost Type] ),
                     [LY Diff %] > [LY Var Percentage Value] ) )
BUT…
you have a few issues here they you need to work out.
The way you are filtering this table isn’t a good idea and will cause this formula to not perform as expected in the card visual

Because your only filtering the table here not the whole page.
I would not do this.
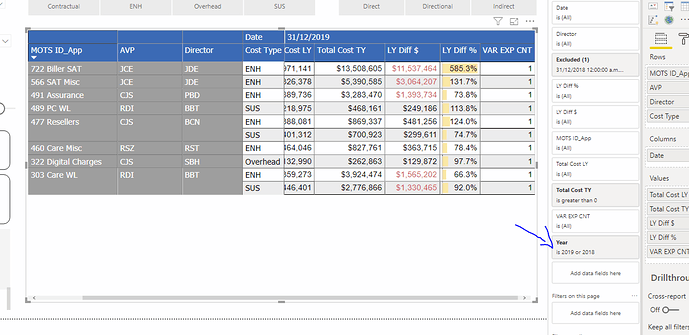
I would place a easy and simple filter or slicer in the report page. This way everything moves together.
You have to remember if you are only slicing in the table then all your other calculations don’t know what year it is, so in this example the LY calculation don’t work because the formula doesn’t know what is the current year and what is last year.
It’s all about understanding deeply the initial context of your calculations.
See how you go sorting this out.
Thanks
Sam


